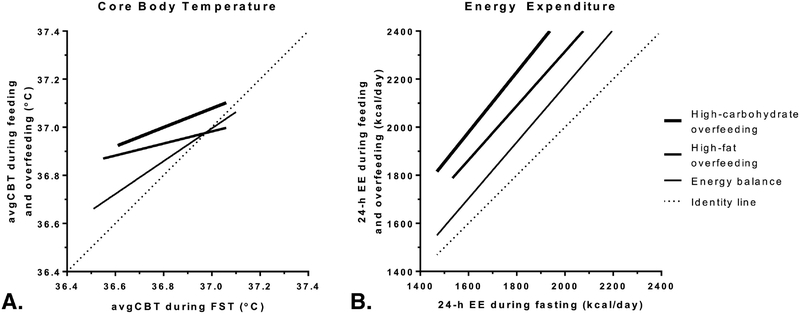
Figure 4. Relationships between CBT and 24-h EE with feeding and overfeeding with respect to their fasting values.
Positive relationships between the mean 24-h core body temperature (avgCBT, Panel A) and 24-h energy expenditure (EE, Panel B) during fasting (FST, x-axis) vs. eucaloric feeding (EBL), 200% high-fat (FNP) and high-carbohydrate (CNP) overfeeding. Solid lines represent best-fit lines in each condition. Strong ceiling effects for the diet-related increases from fasting were observed for avgCBT but not for 24-h EE.

