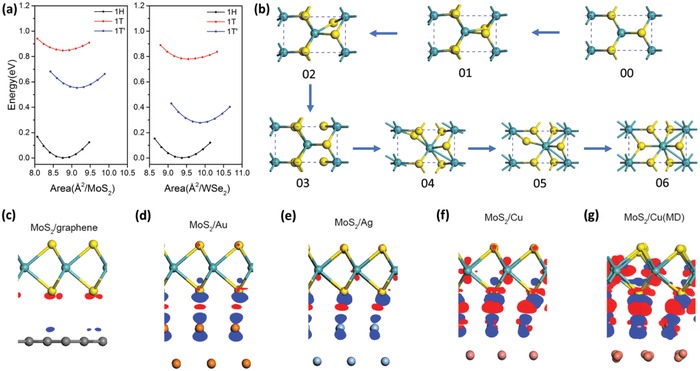
Figure 1.

Phase transition dynamical simulation for MoS2 on metallic substrates. a) Equation of states of MoS2 and WSe2 in 1H, 1T, and 1T'‐phase, respectively. The energy minimum in the curve of 1H‐phase was used as the reference. b) The structural evolution of 1T′‐phase (06) monolayer‐MoS2 from 1H‐phase (00) through the intermediate phases. Blue spheres denote the W atoms while the yellow are S atoms. c–f) The visualized charge density difference of 1H‐MoS2 on graphene, Au, Ag, and Cu substrates, where the isosurface values for MoS2/Au, MoS2/Ag, and MoS2/Cu are 8.0 × 10⁻⁴ e Å−3, while it is 1/10 for MoS2/graphene. The red dots denote the charge accumulation region while the blue dots denote the charge depletion regions. (See also Figure S6, Supporting Information.) g) The visualized charge difference of monolayer 1H‐MoS2/Cu substrates by using an isosurface value of 8.0 × 10⁻⁴ e Å−3 after the molecular dynamics simulations (MoS2/Cu (MD)) with the annealing temperature of 550 K.
