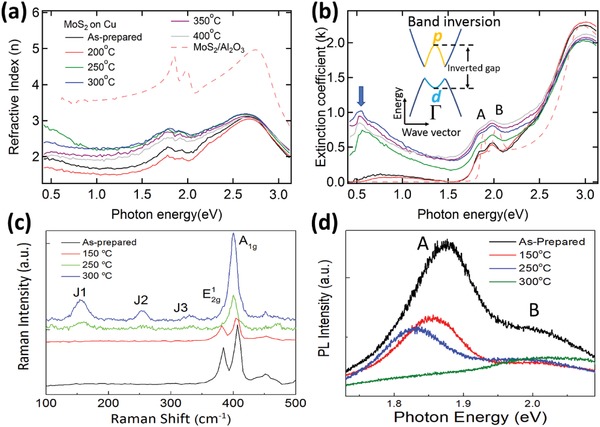
Figure 2.

Optical characterization of MoS2/Cu at various annealing temperatures. a) Refractive index, n(ω), and b) extinction coefficient, k(ω), of MoS2/Cu annealed at various temperatures and MoS2/Al2O3 measured by high‐resolution spectroscopic ellipsometry. The inset is the schematic band structure of 1T′‐MoS2. The lattice distortion along with strong electron–electron correlations in 1T′‐MoS2 results in a band inversion around Γ‐point, which lowers the W d‐orbital below the Se p‐orbital and opens an inverted gap. c) Comparing Raman spectra of MoS2/Cu before and after annealing at 150, 250, and 300 °C. d) Annealing temperature dependent of photoluminescence spectroscopic results.
