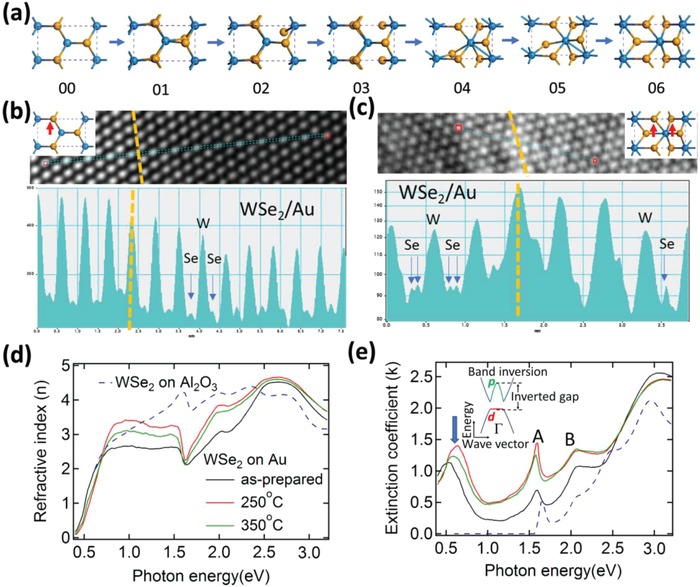
Figure 4.

HRTEM and spectroscopic ellipsometry measurements of WSe2/Au at various annealing temperatures. a) Structural evolution of 1T′‐phase (06) monolayer‐WSe2 from 1H‐phase (00) through the intermediate phases. Blue spheres represent the W atoms while the yellow the S atoms. b,c) Intensity profiles along the blue lines indicated in above HRTEM images of as‐prepared and annealed (at 250 °C) samples. The dark region shows the region where monolayer‐WSe2 lies above the Au substrate (WSe2/Au), while the other is the region where monolayer‐WSe2 is suspended in vacuum. The yellow lines show the boundary between these two regions. d) Refractive index, n(ω), and e) extinction coefficient, k(ω), of WSe2/Au annealed at various temperatures and WSe2/Al2O3 as measured by high‐resolution spectroscopic ellipsometry. The inset shows the schematic band structure of 1T′‐WSe2. The lattice distortion together with the strong electron–electron correlations in 1T′‐WSe2 cause a band inversion around Γ, which lowers the W d‐orbital below the Se p‐orbital and opens an inverted gap.
