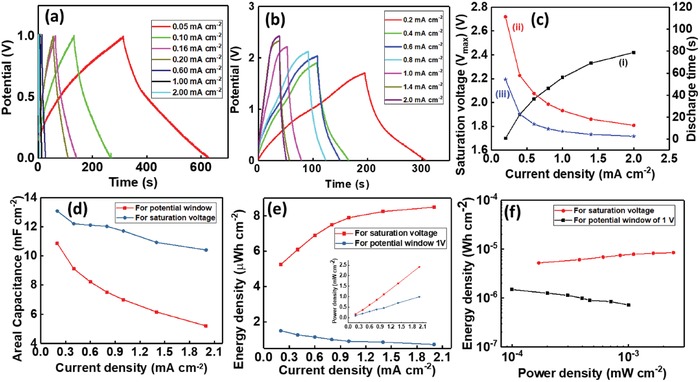
Figure 6.

GCD curves for GS/GPUSC at different current densities in H3PO4 electrolytes for a) the potential window of 0–1 V and b) maximum saturation voltage. c) the variation of i) V sat, ii) discharge time for V sat, and iii) discharge time for potential window of 0–1 V with current density for GS/GPUSC. d) Comparison of areal capacitance with current density at 1 V and V sat for GS/GPUSC. e) Relationship between areal energy density and power density (inset) with current density for V sat and for 0–1 V potential. f) Comparison of Ragone plot of energy density versus power density for V sat and potential window of 0–1 V.
