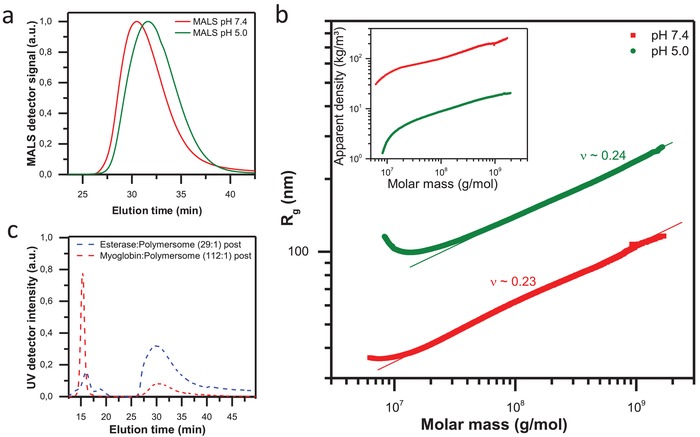
Figure 4.

a) Static light scattering signal of polymersome measured at pH 5 (green lines) and pH 7.4 (red lines) after AF4 separation (method A). b) Conformation plot of polymersome measured at pH 5 (green dots) and pH 7.4 (red dots) indicating uniform particle conformation with well‐defined surface. The inset shows the apparent density calculated according to . c) UV signal after AF4 separation of two systems: free esterase and polymersomes postloaded with esterase (blue line); free myoglobin and polymersomes postloaded with myoglobin (red line).
