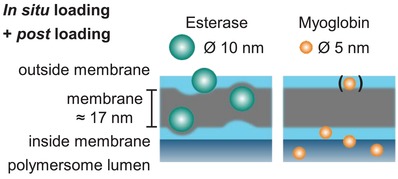
Figure 7.

Schematic representation of protein location and membrane deformation/integration as indicated by AF4 measurements (Esterase: higher scaling parameter ν and lower apparent density to empty polymersomes; Myoglobin: no significant differences compared to empty polymersomes) and myoglobin release studies.
