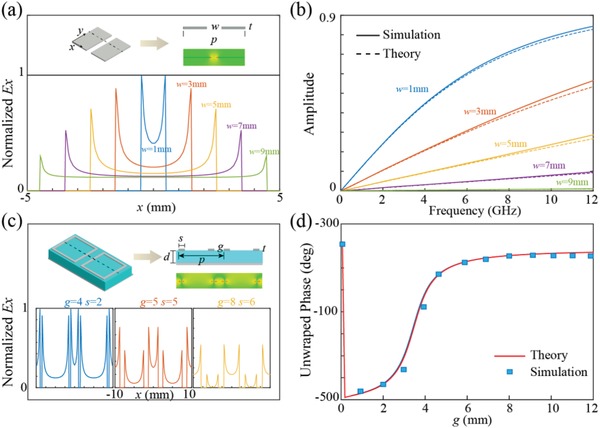
Figure 1.

The catenary models in 1D and 2D structures. a) The extracted electric field distribution in metallic slit with various w at 10 GHz. The upper inset is the schematic of the subwavelength slit with p = 10 mm and the electric field of the incident wave is parallel to the x‐axis. b) The comparison of transmission amplitude between simulated results obtained by CST (solid lines) and their theoretical counterparts calculated by catenary model (dashed lines). c) The extracted electric field distribution in two adjacent CRRs with various g and s. The upper inset is the schematic diagram of the structure with p = 20 mm, d = 5 mm. d) The comparison of unwrapped phase between simulation and theory with different g. The working frequency is f = 4 GHz and s is fixed at 1 mm. Both results show great agreement even g approaches zero.
