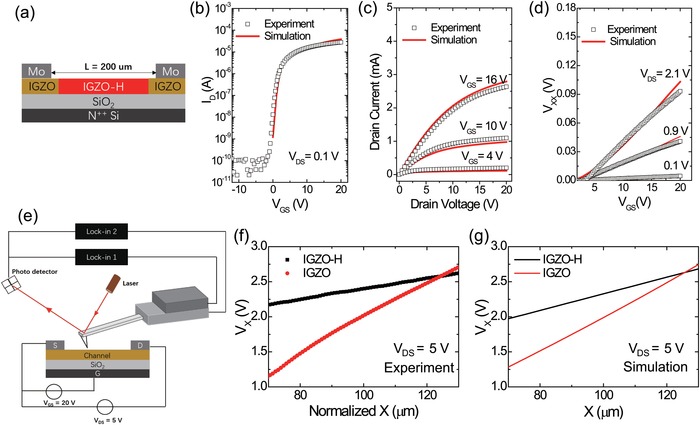
Figure 4.

Simulations and scanning Kelvin probe microscope (SKPM) measurements. a) The proposed structure model, the red area represents doped region with high carrier concentration and the blond area refer to pristine IGZO with no doping. b) The transfer characteristics in linear regime (V DS = 0.1 V). c) Output curves. d) Simulated potential drops V XX under various V DS bias set. e) Schematic view of SKPM measurement. f) Measured and g) simulated results of potential along the channel between probe A and B for both TFTs.
