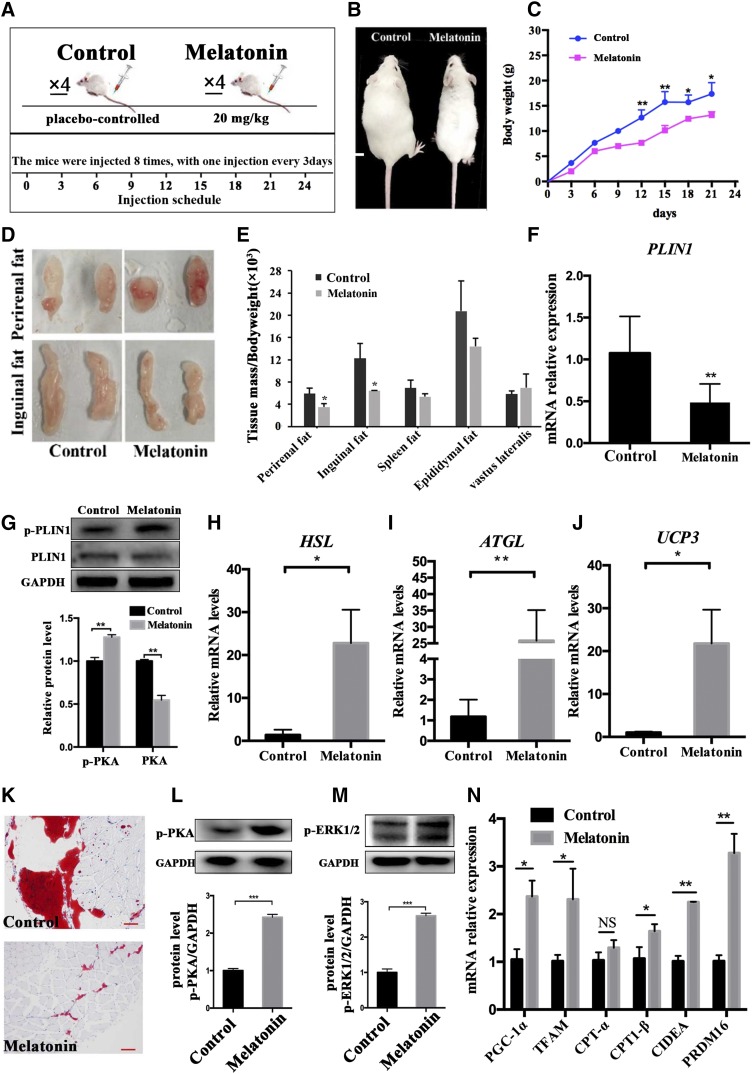
Fig. 9.
Melatonin reduced IMF deposition in the mouse bodies. A: The dosage and frequency of melatonin administration in the mouse model. B: Morphological appearance of mice injected with or without melatonin 24 days later. C: Mouse weight gain curve during injection. D: Morphological appearance of significantly reduced adipose tissue of inguinal and perirenal fat. E: Different adipose tissue/body weight ratio. F, G: The mRNA and protein expression of PLIN1 or p-PLIN1 was tested by RT-qPCR and Western blots in VL muscle. H–J: The mRNA expression levels of HSL (H), ATGL (I), and UCP3 (J) were detected by RT-qPCR in the VL muscle. K: Oil Red O staining of VL muscle adipose tissue sections. L, M: Western blots evaluated the expression p-PKA (L) and p-ERK1/2 (M) in VL muscle. N: RT-qPCR was used to test the expression of mitochondrial biogenesis in PGC-1α, TFAM, CPT-1α, and CPT-1β and browning genes (CIDEA and PRDM16). The results are represented as the mean ± SEM (*P < 0.05; **P < 0.01; ***P < 0.001; n = 4 per group).

