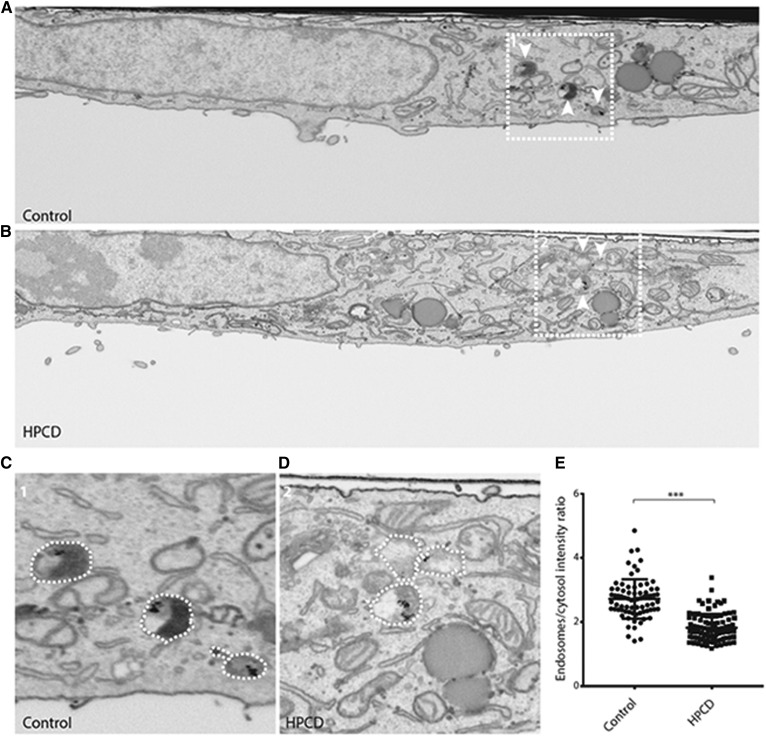
Fig. 5.
HeLa cells treated (B, D) or not (A, C) with HPCD were incubated with 15 nm BSA-gold for 4 h at 37°C and processed for FIB-SEM. Shown are whole-cell slice micrographs (A, B) and high-magnification views of the boxed areas (C, D). White arrowheads indicate BSA-gold positive endosomes. The density of endosomes in was quantified by densitometry, and data are expressed relative to the cytoplasm intensity; controls: two cells, 74 endosomes; HPCD-treated cells: two cells, 95 endosomes. *** P < 0.0001.

