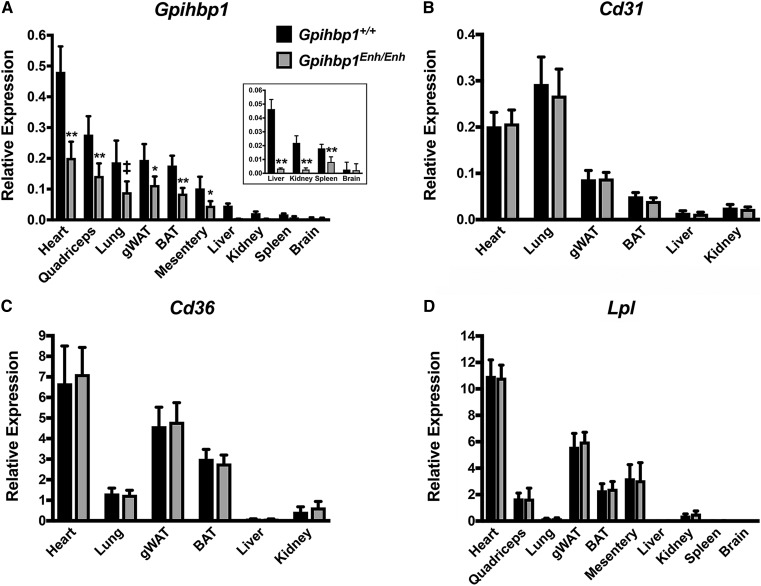
Fig. 2.
Gpihbp1 and Lpl transcript levels in 10-week-old Gpihbp1Enh/Enh and wild-type mice (Gpihbp1+/+). Gpihbp1 (A), Cd31 (B), Cd36 (C), and Lpl (D) transcript levels were measured by qRT-PCR (n = 10/group). Gpihbp1 expression was normalized to the expression of cyclophilin A. gWAT, gonadal white adipose tissue. Data show mean ± SD. ‡P < 0.01; *P < 0.001; **P < 0.0001.

