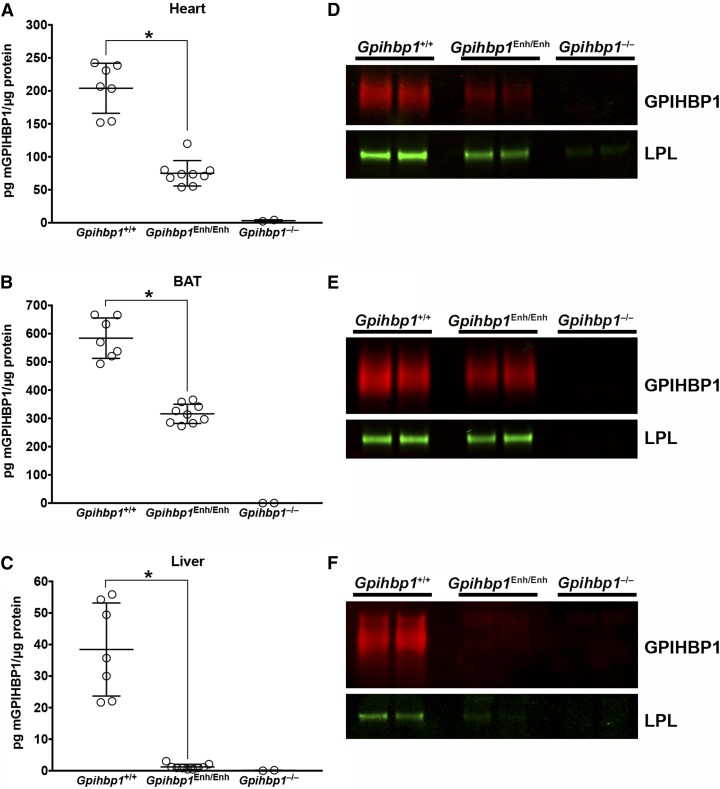
Fig. 3.
Reduced GPIHBP1 protein levels in Gpihbp1Enh/Enh mice. A–C: GPIHBP1 levels in tissue homogenates of heart (A), BAT (B), and liver (C) in 10-week-old mice were measured with a sandwich ELISA. Results are plotted as the mass of GPIHBP1 normalized to total protein (Gpihbp1+/+, n = 7; Gpihbp1Enh/Enh, n = 9; Gpihbp1−/−, n = 2). Data show mean ± SD; *P < 0.0001. D–F: GPIHBP1 and LPL levels in tissues of Gpihbp1Enh/Enh mice, as judged by Western blots. The GPIHBP1 (and any bound LPL) in 200 μg of heart (D) or BAT (E) tissue homogenates [or 1 mg of liver (F) homogenate] were immunoprecipitated with 25 μl of agarose beads coated with the GPIHBP1-specific antibody 11A12 (n = 2 mice/group). Relative amounts of GPIHBP1 and LPL in the immunoprecipitates were assessed by Western blotting with antibodies against GPIHBP1 (red) and LPL (green). GPIHBP1 signals, as judged by an infrared scanner, were quantified in Gpihbp1+/+ heart (1920000 and 1460000) and Gpihbp1Enh/Enh heart (406000 and 246000); Gpihbp1+/+ BAT (20600000 and 14900000) and Gpihbp1Enh/Enh BAT (7280000 and 9490000); and Gpihbp1+/+ liver (1110000 and 1320000) and Gpihbp1Enh/Enh liver (151000 and 163000). The LPL:GPIHBP1 ratio was calculated in Gpihbp1+/+ heart (0.427 and 0.633) and Gpihbp1Enh/Enh heart (1.138 and 1.341), Gpihbp1+/+ BAT (0.022 and 0.032) and Gpihbp1Enh/Enh BAT (0.047 and 0.045), and Gpihbp1+/+ liver (0.015 and 0.009) and Gpihbp1Enh/Enh liver (0.031 and 0.017).

