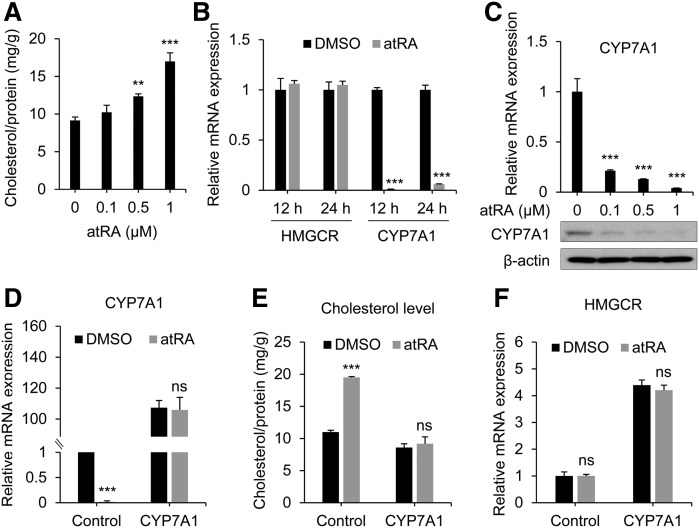
Fig. 1.
atRA induces cholesterol accumulation in HepaRG cells. A: HepaRG cells were treated with the indicated concentrations of atRA for 48 h, and total cholesterol levels were measured (n = 3, mean ± SD). ** P < 0.01; *** P < 0.001 versus control. B: HepaRG cells were treated with atRA (1 µM) for 24 h, and mRNA levels were measured by qPCR (n = 3, mean ± SD). *** P < 0.001 versus control. C: HepaRG cells were treated with indicated concentrations of atRA for 48 h, and mRNA (upper) and protein (lower) levels were determined by qPCR and Western blot analysis, respectively. *** P < 0.001 versus control. D–F: HepaRG cells were infected with 1 × 10⁷ particles of Flag-CYP7A1 lentivirus (or control) in 6-well plates and treated with atRA (1 µM) or DMSO for 72 h. D, F: mRNA levels were measured by qPCR (n = 3, mean ± SD). *** P < 0.001 versus DMSO-treated group. E: Cholesterol levels were measured (n = 3, mean ± SD). *** P < 0.001 versus DMSO-treated group. ns, not significant.

