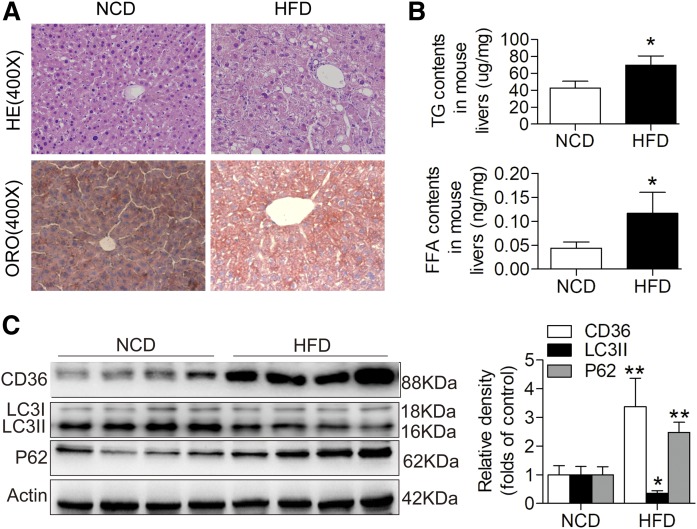
Fig. 1.
Hepatic CD36 expression is increased and autophagy is decreased in response to HFD treatment in mice. A: HE staining (original magnification: ×400) and ORO staining (original magnification: ×400). B: TG and FFA levels in mouse liver tissues. C: Representative Western blotting analysis of CD36, LC3II, and p62 expression in mouse livers. Data are presented as means ± SDs, n = 6. *P < 0.05 and **P < 0.01 versus NCD groups. FFA, free fatty acid; HE, hematoxylin and eosin staining; ORO, Oil Red O.

