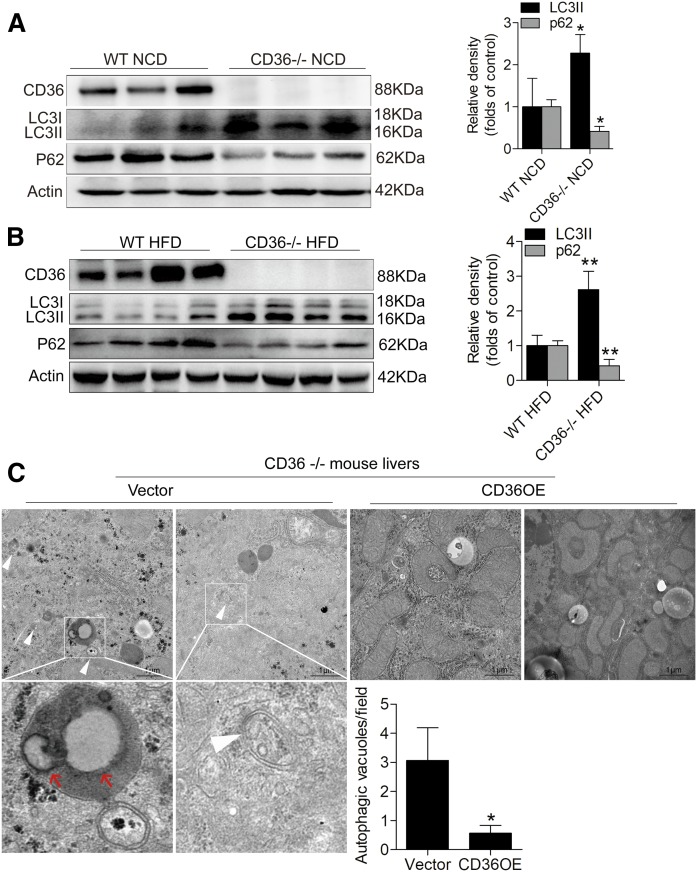
Fig. 3.
CD36 knockout in vivo increases autophagy of mouse livers and its reconstruction in CD36 knockout mice decreases autophagy. A: Western blotting analysis of LC3II and p62 levels in CD36−/− and WT mice fed the NCD. B: Western blotting analysis of LC3II and p62 levels in CD36−/− and WT mice fed the HFD. C: Ultrastructural analysis of the livers of the CD36−/− mice treated with lentivirus empty vector or lentivirus vector containing CD36. The white arrowhead represents autophagic vacuoles (defined to include autophagosomes and autolysosomes), and the red arrowhead represents intralysosomal lipids. Twenty fields were used for the statistical analysis of the number of autophagic vacuoles per field. Data are presented as means ± SDs, n = 6. *P < 0.05 and **P < 0.01 versus respective control groups.

