
Figure 4.
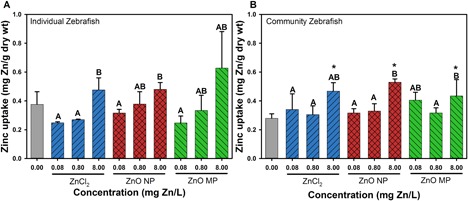
Zebrafish Zn uptake after 120‐h exposure to 0.08, 0.8, and 8 mg Zn/L in individual species (A) and community (B) exposure scenarios. Error bars represent the standard error derived from 5 sample replicates. Uppercase letters indicate significant difference among exposure types at varying concentrations. *Significant difference in uptake relative to control zebrafish. MP = microparticle; NP = nanoparticle.