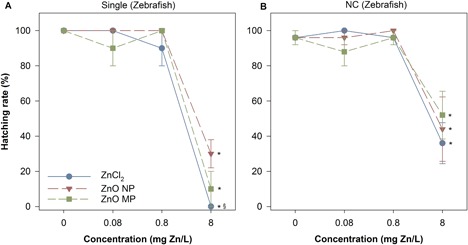
Figure 6.

Zebrafish hatching rate after 120 h in single (a) and NC (b) exposures to single (a) and community (b) exposure conditions. *Significant difference from corresponding control; §significant difference between ZnCl2 and particulate exposures. Error bars represent the standard error derived from 5 sample replicates. MP = microparticle; NC = nanocosm; NP = nanoparticle.
