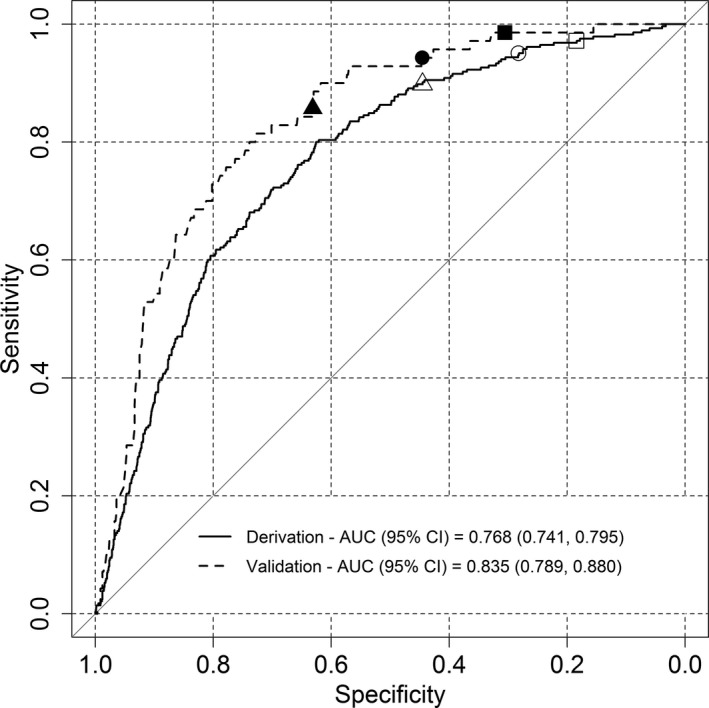
Figure 1.

ROC curve of the haematuria cancer risk score. AUC 0.768 (95% CI: 0.741, 0.795) in the development cohort and AUC 0.835 (95% CI: 0.789, 0.880) in the validation cohort. The white square, circle and triangle give 0.972 (95% CI: 0.954, 0.989), 0.951 (95% CI: 0.923, 0.975) and 0.898 (95 %CI: 0.863, 0.930) sensitivity in the development data set with cut‐off values of 4.015, 4.386 and 4.916, respectively. Using the same cut‐off values, the black square, circle and triangle show 0.986 (95% CI: 0.957, 1.000), 0.943 (95% CI: 0.886, 0.986) and 0.857 (95% CI: 0.771, 0.929) sensitivity in the validation data set, respectively.
