
Figure 1.
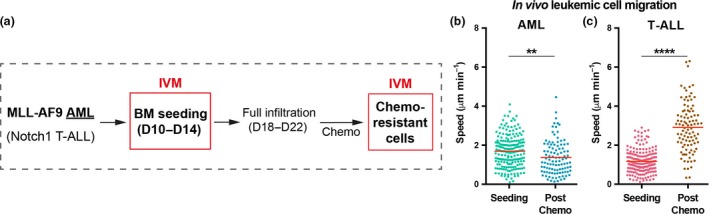
Chemotherapy differentially affects T‐cell acute lymphoblastic leukemia (T‐ALL) and acute myeloid leukemias (AML) cell migration. (a) Intravital imaging schedule of mice carrying either T‐ALL or AML blasts at early disease stages, when individual seeding cells could be tracked, and at later stages, when fully infiltrated mice were treated with disease‐specific chemotherapy and single chemoresistant cells could be monitored. (b, c) Mean speed of single AML (b) and T‐ALL (c) blasts located in the BM parenchyma at early disease stages (“Seeding”) and after chemotherapy (“Post‐chemo”). Data obtained from 3 or 4 mice per condition, from two independent experiments for AML, and from two independent experiments for T‐ALL. Plotted data represent semi‐automatic tracking of (b) 198 seeding AML cells, 103 chemoresistant AML cells, and (c) 187 seeding T‐ALL cells, and 97 chemoresistant T‐ALL cells. It should be noted that seeding single AML cells are significantly faster than seeding T‐ALL cells (P < 0.0001; unpaired t‐test).