Figure 2.

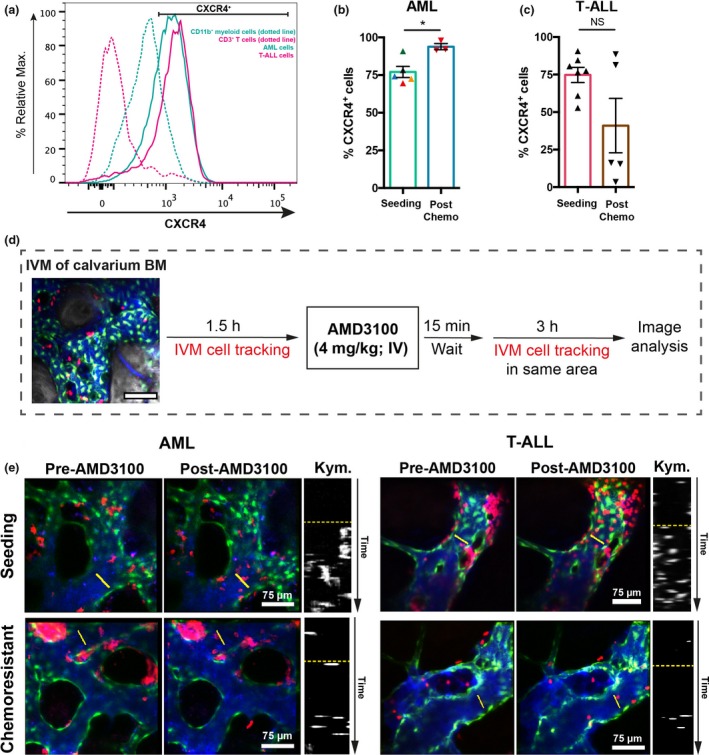
CXCR4 expression and AMD3100 treatment. (a) Flow cytometry analysis of CXCR4 expression in acute myeloid leukemias (AML), T‐cell acute lymphoblastic leukemia (T‐ALL), CD3+ T and CD11b+ myeloid cells. Plots are representative of five independent AML and 4 T‐ALL batches, and bone marrow from three control mice. (b, c) Frequency of CXCR4+ AML (b) and T‐ALL cells (c) before and after chemotherapy treatment, assessed by flow cytometry. (b) Data obtained by an unpaired t‐test from five mice burdened with AML (5 AML batches) untreated and three mice co‐treated with cytarabine and doxorubicin (1 AML batch); each color represents a batch. *P < 0.05 (c) Data obtained from seven mice burdened with T‐ALL, untreated, and five mice co‐treated with dexamethasone, vincristine and l‐asparaginase (1 T‐ALL batch). Error bars: mean ± s.e.m. ns, not significant. See the Methods section. (d) In each imaging session, several positions within the BM space were selected and timelapsed every 3 min, for 90 min. 15 min after injection of AMD3100, the same positions were timelapsed at the same rate for a further 3 h. (e) Maximum intensity projections representative of BM areas showing seeding (four mice analyzed) and chemoresistant (three mice analyzed) AML (left) and seeding (three mice) and chemoresistant (three mice) T‐ALL (right) cell mobilization upon AMD3100 injection. Data are from two independent experiments for AML and from two independent experiments for T‐ALL. Left and middle panels: red, leukemia cells; green, Flk1‐GFP + endothelial cells; blue, Cy5‐ labeled dextran inside blood vessels. Right panels are kymographs displaying a time projection of the vessel sections highlighted by the yellow lines in the left and middle panels. The dotted yellow lines separate time prior to (top) and following (below) AMD3100 administration.
