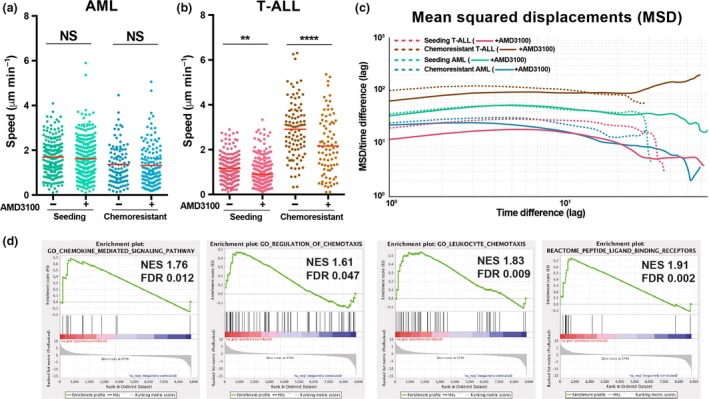
Figure 3.

The effect of AMD3100 on in vivo leukemic cell migration. (a, b) Mean speed of single acute myeloid leukemias (AML) (a) and T‐cell acute lymphoblastic leukemia (T‐ALL) (b) cells tracked before (−) (same data as in Figure 1b, c) and after (+) exposure to AMD3100. Data obtained for (a) AML seeding: n = 198 cells (−), n = 262 (+) from four mice; AML chemoresistant: n = 103 cells (−) and n = 134 cells (+) from three mice. Data obtained for (b) T‐ALL seeding: n = 187 cells (−), n = 265 cells (+) from three mice; T‐ALL chemoresistant: n = 97 cells (−), n = 83 cells (+) from three mice. Data are from three independent experiments for AML and from three independent experiments for T‐ALL (unpaired t‐test). **P < 0.01, ****P < 0.0001. See the Methods section. (c) Mean‐squared displacements (MSD) of cell tracks were analyzed to characterize the displacements in terms of diffusivity. The log–log plot compares the average squared displacement as a function of the time difference/lag (x axis) divided by the lag, for each condition. Chemoresistant T‐ALL cells, upon AMD3100 exposure, changed from diffusive/subdiffusive to superdiffusive motion (red arrow; upward thick brown line). (d) Gene Set Enrichment Analysis (GSEA) comparing AML and T‐ALL cells isolated from fully infiltrated BM for genes involved in chemotaxis and chemokine signaling pathways. n = 6 mice (T‐ALL) and nine mice (AML), each from one independent experiment.
