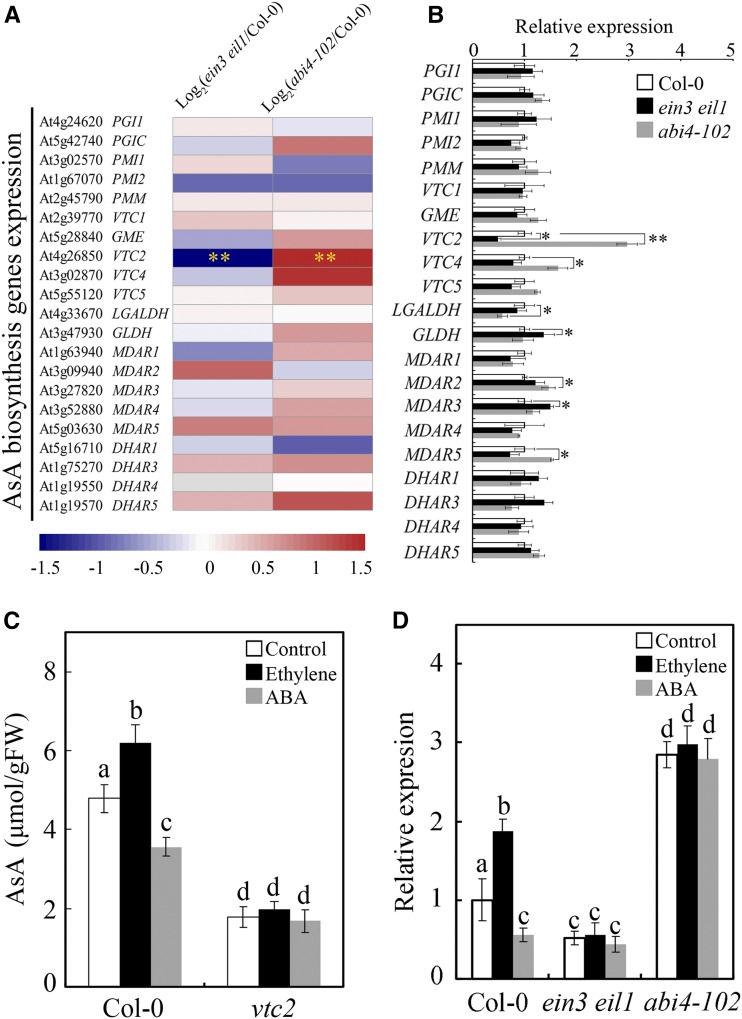
Figure 5.
VTC2 is required in EIN3-ABI4-regulated AsA biosynthesis. A, Transcriptome data of AsA biosynthesis genes in ein3 eil1 and abi4-102 mutants. The bar represents the log2 fold change. Double asterisks indicate statistically significant differences between mutants and Col-0 with a fold change > 2 and P < 0.01. B, Expression of AsA biosynthesis genes in Col-0, ein3 eil1, and abi4-102. ABI4 transcript levels were detected by RT-qPCR and normalized to reference gene ACTIN2. Asterisks indicate statistically significant differences between mutants and Col-0 using two-tailed Student’s t test (*, P < 0.05 and **, P < 0.01). C, AsA contents in Col-0 and vtc2 in response to treatment with ethylene or ABA. D, Expression of VTC2 in Col-0, ein3 eil1, and abi4-102 cells treated with ethylene or ABA. Seven-day-old seedlings were treated with ethylene or ABA for 12 h (C) or 2 h (D). Values are means ± sd (n = 3). Different letters in C and D indicate statistically significant differences (P < 0.05, ANOVA with Tukey’s test). FW, Fresh weight.

