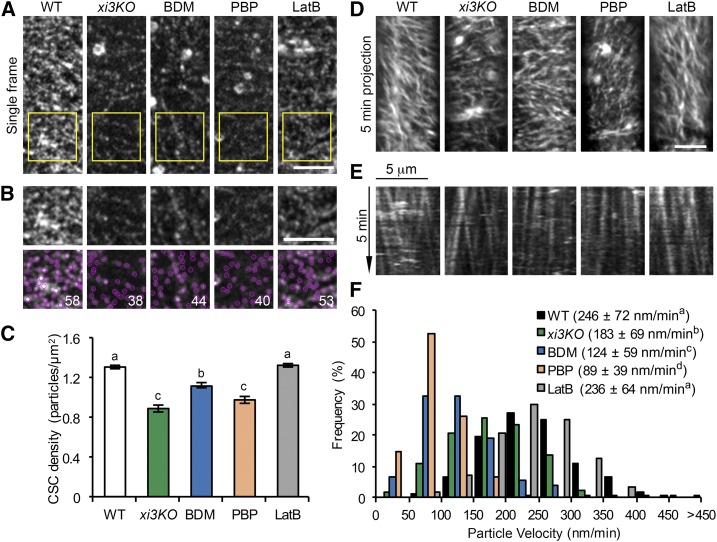
Figure 3.
The density and motility of CSC particles at the plasma membrane are reduced in myosin-deficient cells. Etiolated hypocotyl epidermal cells of xi3KO or wild-type (WT) siblings expressing YFP-CESA6 were imaged with SDCM. Seedlings were pretreated with mock (0.2% DMSO), 30 mm BDM, 10 µm PBP, or 10 µm LatB for 15 min. A, Representative single-frame images show the distribution of CSCs at the PM. Bar, 5 µm. B, Selected regions (yellow box) in A were magnified and CSC particles detected (marked in magenta). The number of particles in each region is shown in white. Bar, 5 µm. C, Quantitative analysis shows that the density of CSCs at the PM was significantly reduced in xi3KO or after BDM and PBP treatment, but not in LatB-treated cells. Values given are means ± se (n ≥ 35 cells from 10 hypocotyls per treatment; more than 12,000 particles were measured from total areas of > 9,400 µm2 in wild-type, xi3KO, and BDM-, PBP-, and LatB-treated cells (one-way ANOVA with Tukey’s post-hoc test, P < 0.01). D, Representative time projections show the trajectories of CSCs at the PM. Time projections were generated by average intensity with 61 frames collected at 5-s intervals. Bar, 5 µm. E, Representative kymographs show the movement of CSCs during a 5-min interval. F, Quantitative analysis shows the distribution and average velocities of CSCs. The average CSC velocities in xi3KO and BDM- and PBP-treated cells were greatly reduced compared to wild-type or LatB-treated cells. Values given are means ± sd (n > 500 CSC trajectories per treatment, one-way ANOVA with Tukey’s post-hoc test, letters [a–d] denote samples/groups that show statistically significant differences from other groups, P < 0.05).

