Figure 5.
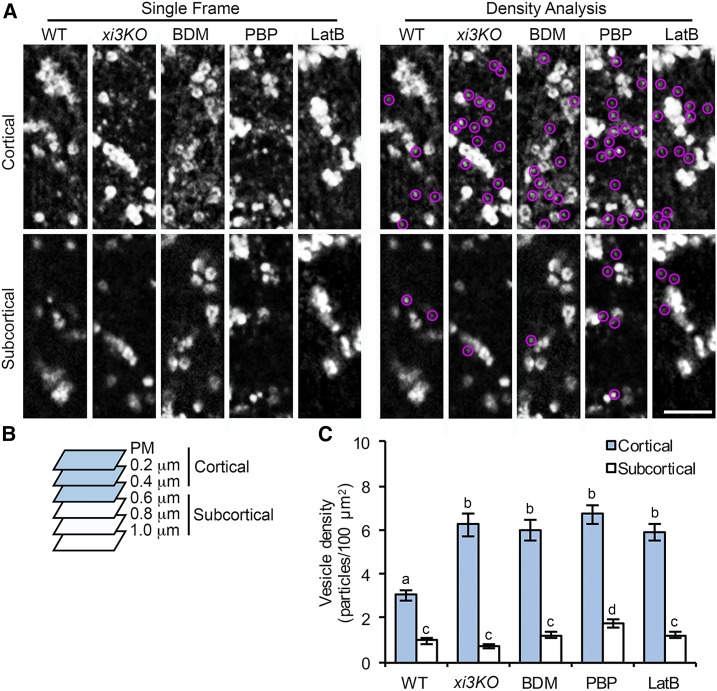
The density of small CESA compartments is increased in the cell cortex following myosin inhibition. A, Representative single frames taken at cortical and subcortical focal planes in hypocotyl epidermal cells. Seedlings of xi3KO or wild-type (WT) siblings expressing YFP-CESA6 were treated with mock (0.2% DMSO), 30 mm BDM, 10 µm PBP, or 10 µm LatB for 15 min prior to imaging. The cytoplasmic CESA compartments are highlighted with magenta circles. Bar, 5 µm. B, Diagram shows that optical sections of 0.2-µm step size were taken by SDCM starting at the PM. Focal planes from the PM to 0.4 µm below the PM were defined as cortical cytoplasm and from 0.6 µm to 1.0 µm were defined as subcortical cytoplasm. C, Quantitative analysis of vesicle density shows that the number of CESA compartments was increased significantly in the cortical but not the subcortical cytoplasm in xi3KO and BDM-, PBP-, and LatB-treated cells. Values given are means ± se (n ≥ 20 cells from 10 seedlings for each genotype or treatment; a total of 333, 567, 790, 686, and 602 compartments were measured from total areas of 8,344, 8,418, 11,229, 8,321, and 8,041 µm2 in wild-type, xi3KO, and BDM-, PBP-, and LatB-treated cells, respectively; one-way ANOVA with Tukey’s post-hoc test; letters [a–d] denote samples/groups that show statistically significant differences with other groups, P < 0.05).

