Figure 8.
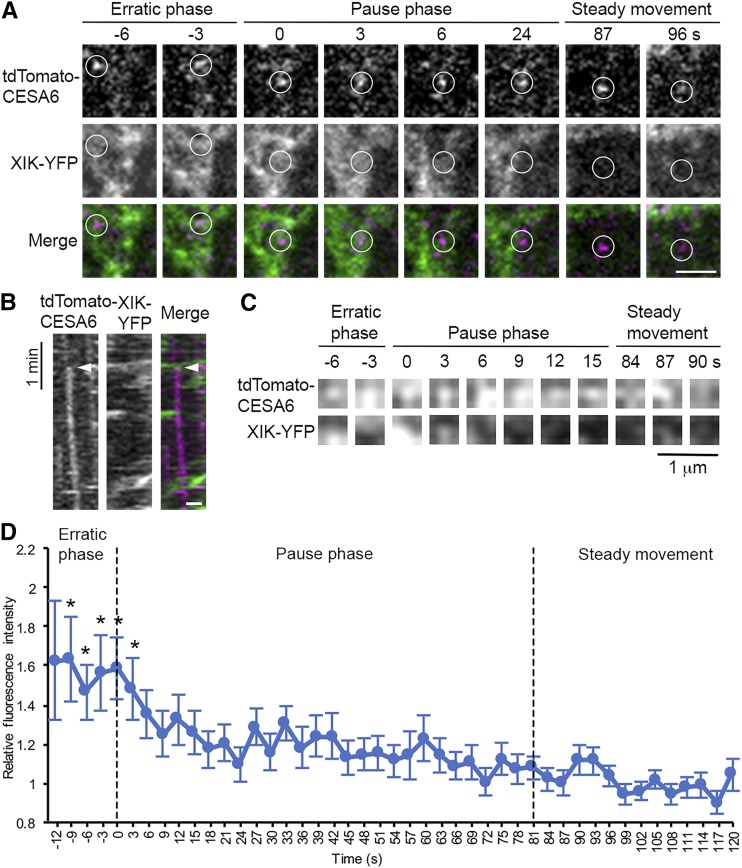
Arrival of MYOSIN XIK at the site of CESA6 insertion into the PM is early and transient. MYOSIN XIK-YFP and tdTomato-CESA6 were visualized at insertion sites by two-color time-lapse imaging using SDCM. A, Representative images from a time series taken from the cortical cytoplasm of a hypocotyl epidermal cell show that diffuse XIK-YFP signal was colocalized with a newly arrived CSC vesicle (white circles) during the entirety of the erratic phase as well as the first few seconds of the pause phase, but not during the steady migration phase. In the merged images, the XIK-YFP channel is shown in green and tdTomato-CESA6 in magenta. The entire time series is available as Supplemental Movie S8. Bar, 2 µm. B, Kymograph prepared from representative images shown in A demonstrates transient colocalization of XIK-YFP (green) with tdTomato-CESA6 (magenta) at the beginning of the pause phase (white arrowheads). Bar, 1 µm. C, Another representative time-lapse series showing a small ROI (3 × 3 pixels) selected at the centroid of a single CSC vesicle or particle. The ROI, defined by the presence of CESA6, was tracked in both channels during the erratic phase, pause phase, and the steady movement phase. The ROI in the XIK-YFP channel was extracted for analysis of fluorescence intensity. D, Quantitative analysis of mean fluorescence intensity of XIK-YFP in ROIs from multiple insertion events in different epidermal cells. The fluorescence intensity was normalized using the intensity of the ROI in each frame divided by the average intensity of ROIs from the steady movement phase, assuming that any myosin associated with an active translocating CSC represents a random event. There was significantly higher fluorescence intensity of XIK-YFP during the erratic phase of CSC particles as well as the first 3 s of the pause phase, compared with the remainder of the pause phase and the beginning of the steady movement phase. Values given are means ± se (n = 64 insertion events analyzed from 13 cells in seven seedlings; because the duration of the erratic phase varied among different insertion events, the sample sizes at −12 s, −9 s, −6 s, and −3 s were 5, 16, 28, and 50, respectively; X-bar and S Control Charts were used for statistical comparison of timepoints; *P < 0.05).

