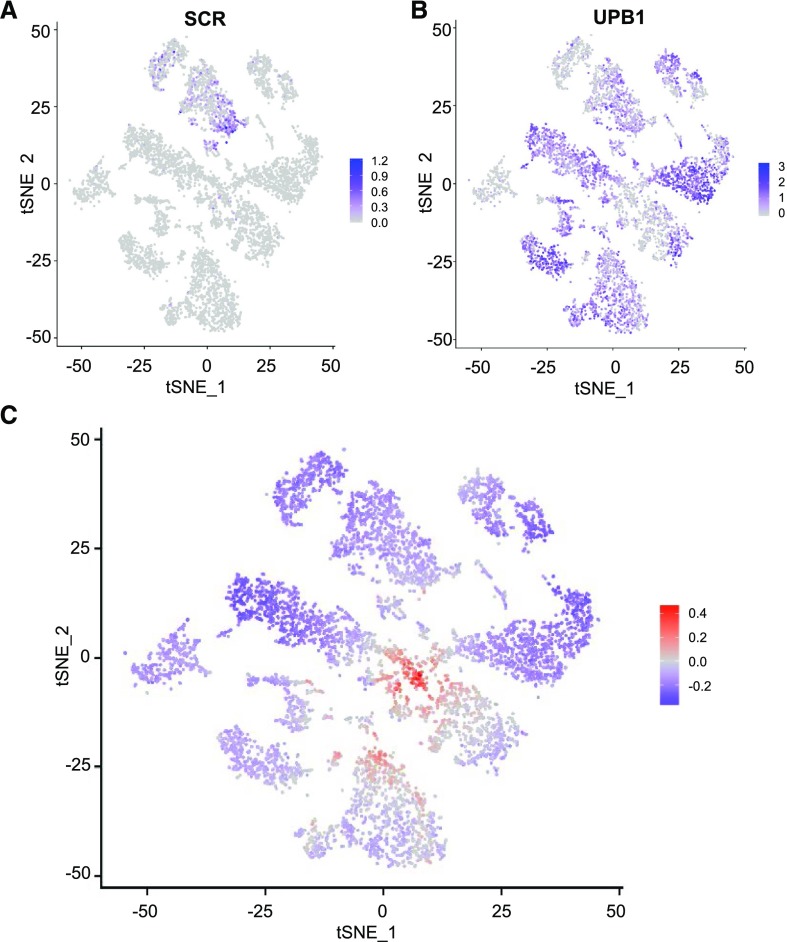
Figure 3.
Intracluster developmental variation in gene expression. A and B, tSNE projection plots showing transcript accumulation across the single cell population for the early ground tissue marker gene SCARECROW (SCR; A) and the elongation zone marker gene UPBEAT (UPB; B). Color intensity indicates the relative transcript level for the indicated gene in each cell. C, tSNE projection plot showing relative differentiation status of all cells in the population. The log ratio of meristematic zone gene expression to differentiation zone gene expression was calculated for each cell and plotted using the indicated color scheme (red indicates preferential meristem expressed genes; blue indicates preferential differentiation zone-expressed genes).

