Figure 4.
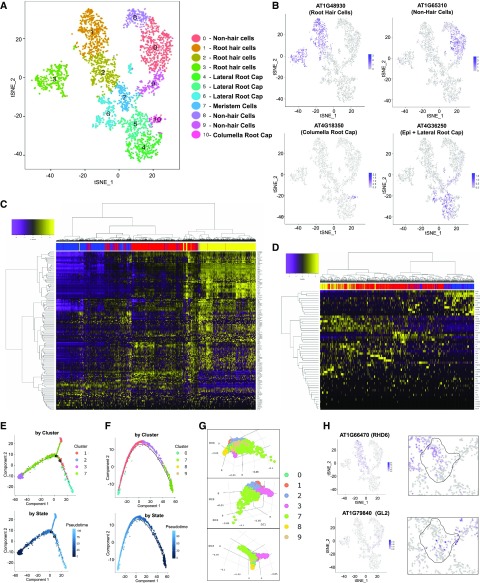
Analysis of single-cell transcriptomes from root epidermis and root cap tissues. A, tSNE projection plot showing 11 major clusters of cell transcriptomes. The specific cell/tissue types assigned to each cluster are indicated. B, tSNE projection plots showing accumulation of epidermal and root cap marker gene transcripts in individual cells. Color intensity indicates the relative transcript level for the indicated gene in each cell. The cell types known to preferentially express each marker gene are indicated in parentheses (details available in Supplemental Table S3). Additional marker gene plots are provided in Supplemental Figure S4. C, Heat maps illustrating transcript accumulation for 150 previously defined root-hair expressed genes (Bruex et al., 2012) in the cells from the root-hair clusters (clusters 1, 2, 3). The bar at the top of the map indicates the cluster origin for each cell (blue = cluster 2; red = cluster 1; yellow = cluster 3). D, Heat maps illustrating transcript accumulation for 52 previously defined nonhair expressed genes (Bruex et al., 2012) in the cells from the nonhair clusters (clusters 0, 8, 9). The bar at the top of the map indicates the cluster origin for each cell (yellow = cluster 9; red = cluster 0; blue = cluster 8). E, Pseudotime analysis using Monocle for cell transcriptomes in clusters 1,2,3,7 shows the developmental trajectory for the differentiating root-hair cells. F, Pseudotime analysis using Monocle for cell transcriptomes in clusters 0,7,8,9 shows the developmental trajectory for the differentiating nonhair cells. G, Diffusion plot of cells from clusters 0,1, 2, 3, 7, 8, and 9 using Destiny to indicate gene expression relationships among cells. Each panel represents a different two-dimensional view of a three-dimensional plot. H, tSNE projection plots showing transcript accumulation for early markers of root-hair (ROOT HAIR DEFECTIVE 6 [RHD6]) and nonhair (GLABRA 2 [GL2]) cell differentiation known to initiate expression in the meristematic epidermal cells. The right panels show a magnified view of the center of the plot, with the meristem cell cluster (cluster 7) outlined. tSNE projection plots showing additional early marker gene plots for root-hair (MYC-RELATED PROTEIN 1 and ENHANCER OF GLABRA 3) and nonhair (TRANSPARENT TESTA GLABRA 2 and ENHANCER OF TRY AND CPC 1) cell markers are provided in Supplemental Figure S5.

