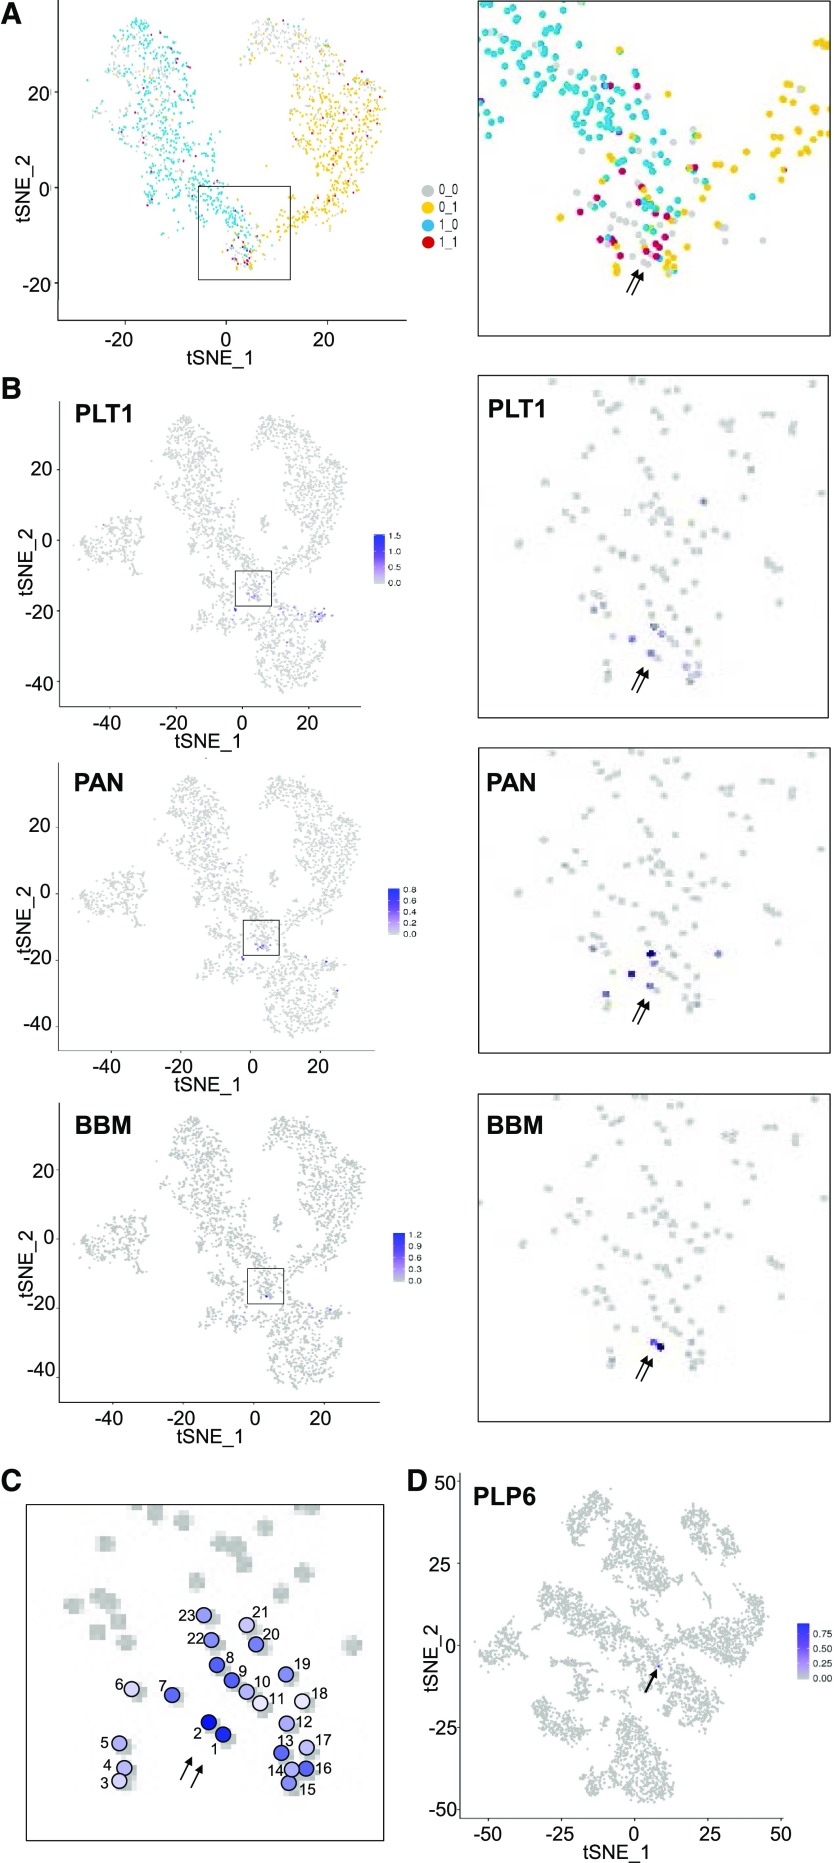
Figure 5.
Identification of putative QC cells. A, Coexpression analysis of early root-hair and early nonhair transcriptional regulators in cell transcriptomes from clusters 0,1,2,7,8,9. tSNE projection plots showing cells that express at least one of the early root-hair cell markers RHD6, MYC1, and EGL3 (blue dots) and cells that express at least one of the early nonhair cell markers GL2, TTG2, and ETC1 (yellow dots). Red dots indicate cells that express at least one early root-hair marker and at least one early nonhair marker. Right is a magnified view of the cluster 7 region of the plot. Arrows indicate the location of the two putative quiescent center cells. B, tSNE projection plot showing transcript accumulation across the single cell population for known QC genes. Color intensity indicates the relative transcript level in each cell for the PLETHORA 1 (PLT1), PERIANTHIA (PAN), and BABY BOOM (BBM) genes. Additional QC marker gene plots are provided in Supplemental Figure S6. Right panels present a magnified view of the cluster 7 region of the plot. Arrows indicate the location of the two putative quiescent center cells. C, Aggregate expression data from 52 QC marker genes among 23 cells of cluster 7. Color intensity indicates the relative number and level of QC marker gene expression in each of the numbered cells. Arrows indicate the location of the two putative quiescent center cells. D, tSNE projection plot showing transcript accumulation across the entire wild-type root single cell population (from Fig. 1) for PLP6, a putative QC-specific gene. The locations of the two putative QC cells are indicated by an arrow.

