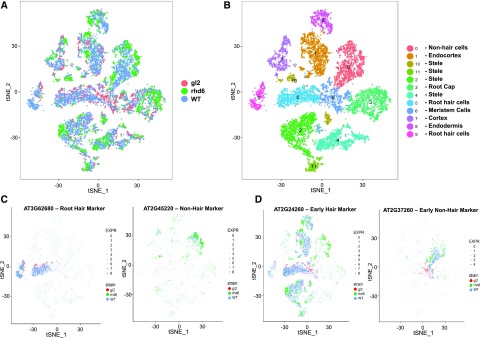
Figure 6.
Comparative single-cell transcriptome analysis of wild-type and root epidermis mutant roots. A, tSNE projection plot showing distribution of the wild-type (WT), rhd6 mutant, and gl2 mutant cell transcriptomes. Cell transcriptomes derived from each genotype are indicated by different colors (red = gl2; green = rhd6; blue = wild type). B, tSNE projection plot showing 12 major clusters of cell transcriptomes from the wild type, rhd6 mutant, and gl2 mutant. The specific tissue/cell types assigned to each cluster are indicated. C, tSNE projection plots showing accumulation of root-hair and nonhair marker gene transcripts in individual cell transcriptomes from wild-type, rhd6 mutant, and gl2 mutant. Color intensity indicates the relative transcript level for the indicated gene in each cell for each genotype (red = gl2; green = rhd6; blue = wild type). Additional marker gene plots are provided in Supplemental Figure S9. D, tSNE projection plots showing transcript accumulation from wild-type, rhd6 mutant, and gl2 mutant cell transcriptomes for root-hair and nonhair marker genes that initiate expression at a relatively early stage. Color intensity indicates the relative transcript level for the indicated gene in each cell for each genotype (red = gl2; green = rhd6; blue = wild type). Additional marker gene plots are provided in Supplemental Figure S9.

