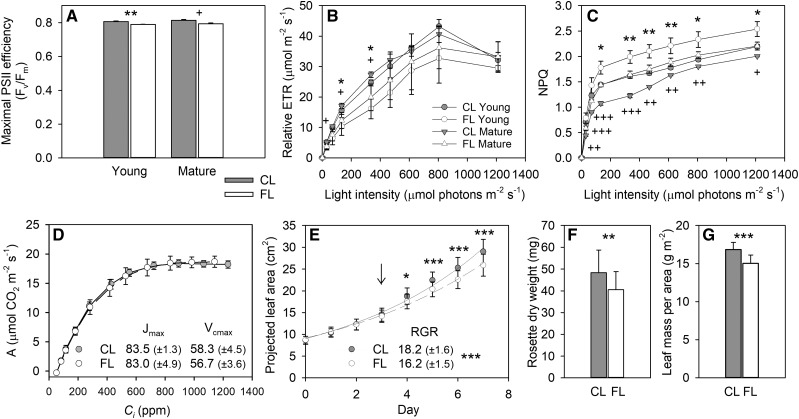
Figure 2.
Changes in PSII activity, CO2 assimilation, and leaf growth. A to C, The Fv/Fm (A), rapid light response curves of relative ETR (B), and NPQ (C) were measured in Young and Mature leaves after 3-d exposure to FL or CL. Data are means ± sd, n = 3. D, A/Ci curves measured in Mature leaves after 3-d exposure to FL or CL. Data were recorded at steady state in saturating light intensity (800 μmol photons m−2 s−1). The maximum rates of RuBP regeneration (Jmax; μmol m−2 s−1, ±sd) and Rubisco carboxylation (Vcmax; μmol m−2 s−1, ±sd) were calculated by fitting the A/Ci curves according to Sharkey et al. (2007). Data are means ± sd, n = 5. E, Increase in projected leaf area during the 7-d experiment. Data are means ± sd, n = 45 and 42 for FL and CL, respectively. The relative growth rate (RGR; % d−1, ±sd) was calculated by fitting the leaf area data to an exponential growth function (R2 = 0.9913 and 0.9885 for FL and CL, respectively). Leaf samples were taken on day 3 (arrow) for different analyses. For metabolome analysis, Mature leaves were collected on day 7. F and G, The dry weight of rosette (F) and leaf dry mass per area (G) at the end of the 7-d treatment. Data are means ± sd, n = 17 and 20 for FL and CL, respectively. Asterisks and plus signs in A to C denote significant differences between FL and CL for Young and Mature leaves, respectively (*** and +++, P < 0.001; ** and ++, P < 0.01; * and +, P < 0.05 by Student’s t test). Asterisks in E to G are for significant differences between the plants grown under FL and CL.

