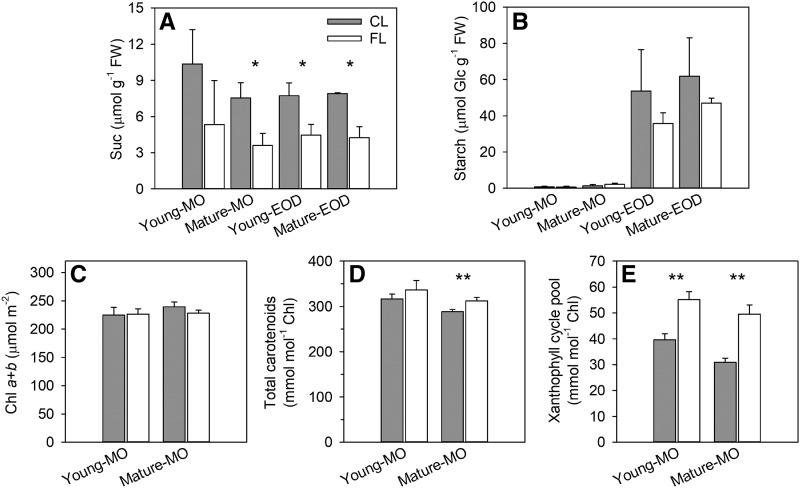
Figure 3.
Nonstructural carbohydrate and photosynthetic pigment contents of Young and Mature leaves on day 3. A and B, Levels of Suc (A) and starch (B; determined as Glc) in MO and at EOD. Data are means ± sd, n = 3. FW, Fresh weight. C to E, Levels of Chls (C), carotenoids (D), and xanthophyll cycle pigments (E) in MO. Data are means ± sd, n = 4. Asterisks denote significant differences between FL and CL (**, P < 0.01 and *, P < 0.05 by Student’s t test).

