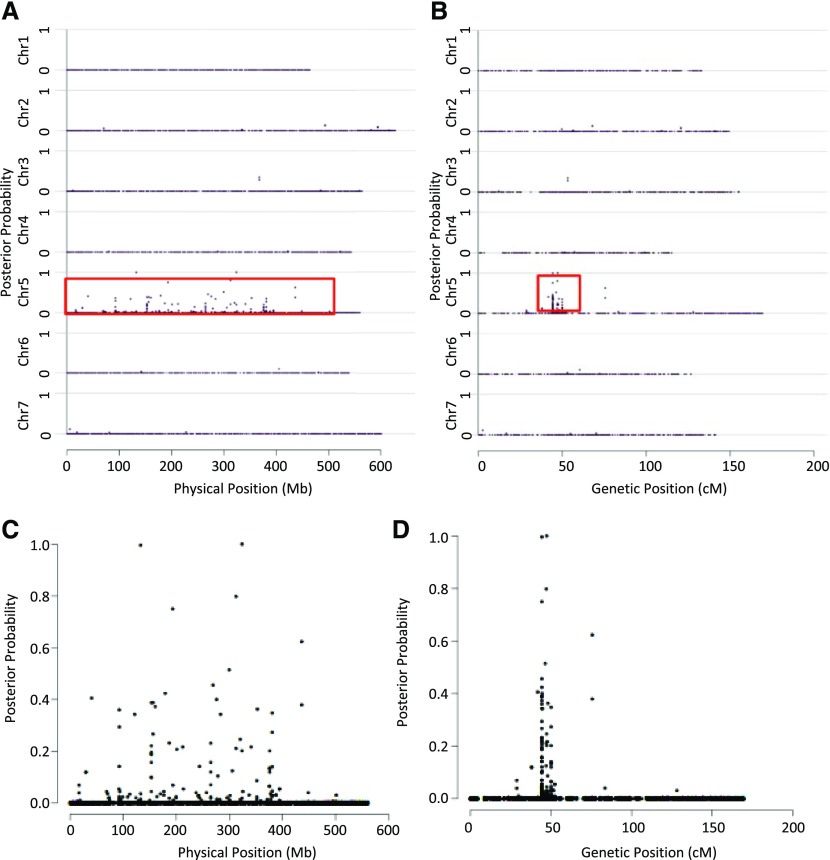
Figure 2.
BSR-seq localizes lys3a to chromosome 5H. Posterior probabilities of SNPs putatively cosegregating with lys3a are depicted on the y axis, while physical position (A and C) and genetic position (B and D) are shown on the x axis. A and B show all seven barley chromosomes, while C and D depict chromosome 5H only.

