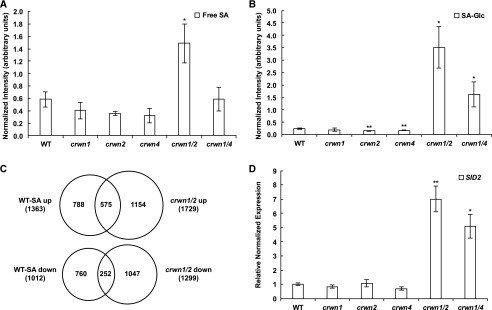
Figure 4.
SA levels in crwn1 crwn2 and crwn1 crwn4 mutants are significantly higher than in wild-type (WT) plants or crwn single mutants. A, HPLC/MS detection of free SA levels from 27-d-old plants. Peak intensities of free SA per fresh sample weight were normalized to the spiked internal control d4-SA. Each mutant was compared with the wild type using Student’s t test, and error bars indicate sd (*, P < 0.05; n = 3). B, HPLC/MS detection of glucosylated SA (SA-Glc, indicating either SA glucoside or salicylate Glc ester) levels from each mutant. The detection method, units, and statistical analysis were identical to those described for A (*, P < 0.05 and **, P < 0.01). C, Overlap of misregulated genes in our RNA-seq data from crwn1 crwn2 mutants and those in microarray data from 1 mm SA-treated wild-type plants (Zhou et al., 2015). For SA-treated wild-type microarray data, genes at least 2-fold increased or decreased with adjusted P < 0.05 were used. For the RNA-seq of crwn1 crwn2 mutants, the criteria described in Figure 1 were used. The significance of the overlap of both up-regulated and down-regulated gene comparisons was assessed by the hypergeometric test; the resulting P values in both cases were far less than 0.001. D, RT-qPCR data showing expression of the SID2 gene in 27-d-old plants. Error bars indicate se (n = 3). Student’s t tests were performed based on delta-Ct values (*, P < 0.05 and **, P < 0.01).

