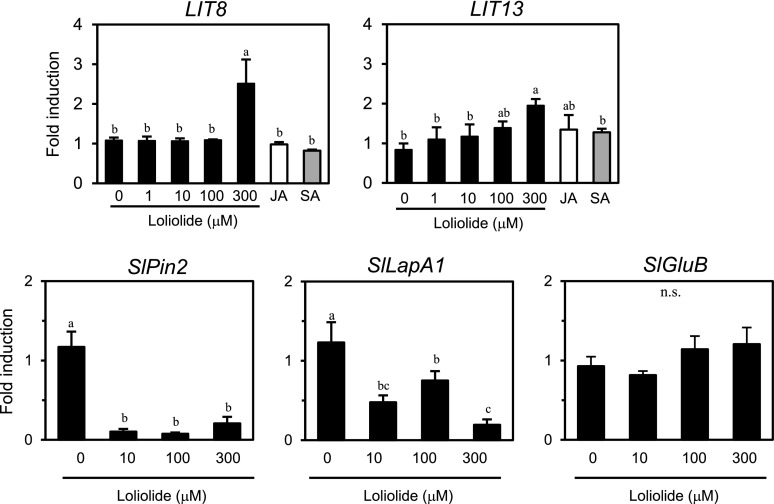
Figure 5.
Gene expression analysis of tomato plants after a treatment with loliolide. Reverse transcription quantitative-PCR analysis of the indicated genes in tomato leaves 12 h after the treatment with different concentrations of loliolide, 10 μM methyl JA, 100 μM SA, or 0.1% methanol (0 μM) as a control. Values are the mean ± sd (n = three replicates). Different letters indicate significant differences among treatments (for LIT8, LIT13, SlPin2, and SlLapA1, P < 0.05, Tukey-Kramer HSD test; for SlGluB, P > 0.05, Tukey-Kramer HSD test).

