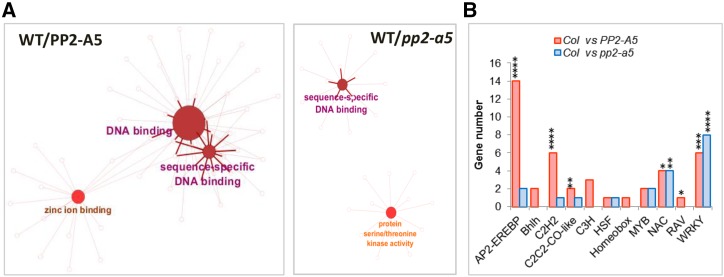
Figure 7.
Expression analysis of DEGs from enriched molecular functions. A, Functionally grouped network of molecular function enriched categories after ClueGO analysis of DEGs between wild type (WT)/PP2-A5 or wild type/pp2-a5. GO terms are represented as nodes, and the node size represents the term enrichment significance. Edges represent connections between GO term nodes and gene nodes associated with each group. B, Number of identified DEGs in the wild type/PP2-A5 and wild type/pp2-a5 comparisons for each transcription factor family (AP2-EREBP, Bhlh, C2H2, CC2C2-CO-like, C3H, HSF, Homeobox, MYB, NAC, RAV, and WRKY). Asterisks mark transcription factor enrichments identified by Fisher’s exact test (*, P < 0.05; **, P < 0.01; ***, P < 0.001; and ****, P < 0.0001).

