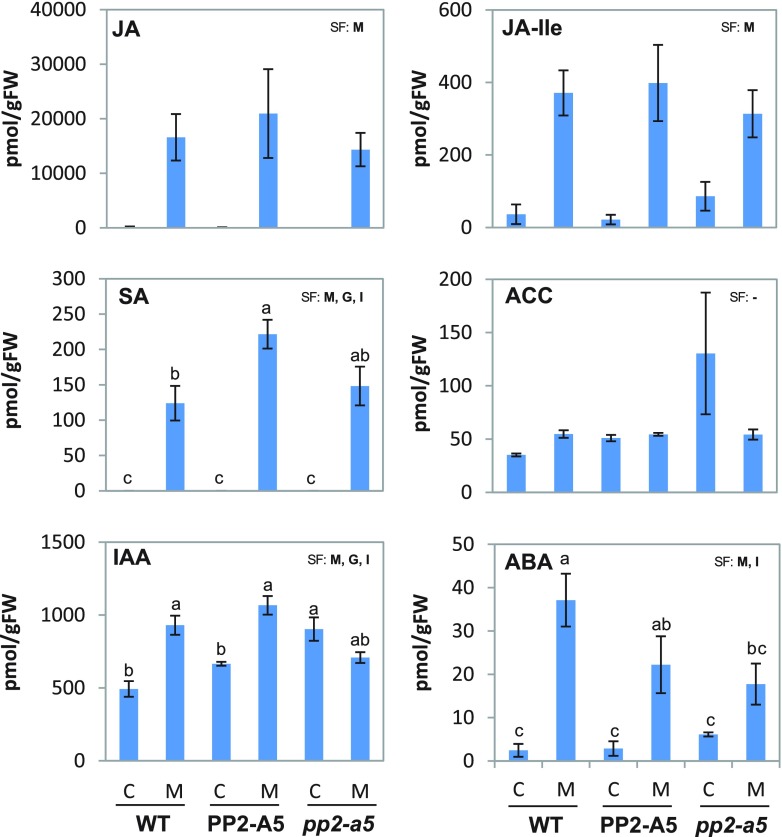
Figure 8.
Quantification of hormones in the three PP2-A5 Col-0 genotypes infested with T. urticae. Quantifications were determined in 3-week-old-rosettes from PP2-A5_2.3, pp2-a5, and the wild type (WT). Values of JA, JA-Ile, SA, ACC, IAA, and ABA are expressed as pmol of each hormone (JA, JA-Ile, SA, IAA, and ABA) or hormone precursor (ACC) per g fresh weight (FW) and are means ± se of four biological replicates. Significant factors (SF) indicate whether the two independent factors, G (genotype) and M (mite infestation), and/or their interaction, I (G × M), were statistically significant (two-way ANOVA, P < 0.05). When the interaction was significant, Tukey’s posthoc test was performed. Different lowercase letters indicate significant differences between treatments/genotypes. P values of the two-way ANOVA are shown in Supplemental Table S5. C, Control noninfested plants; M, mite-infested plants.

