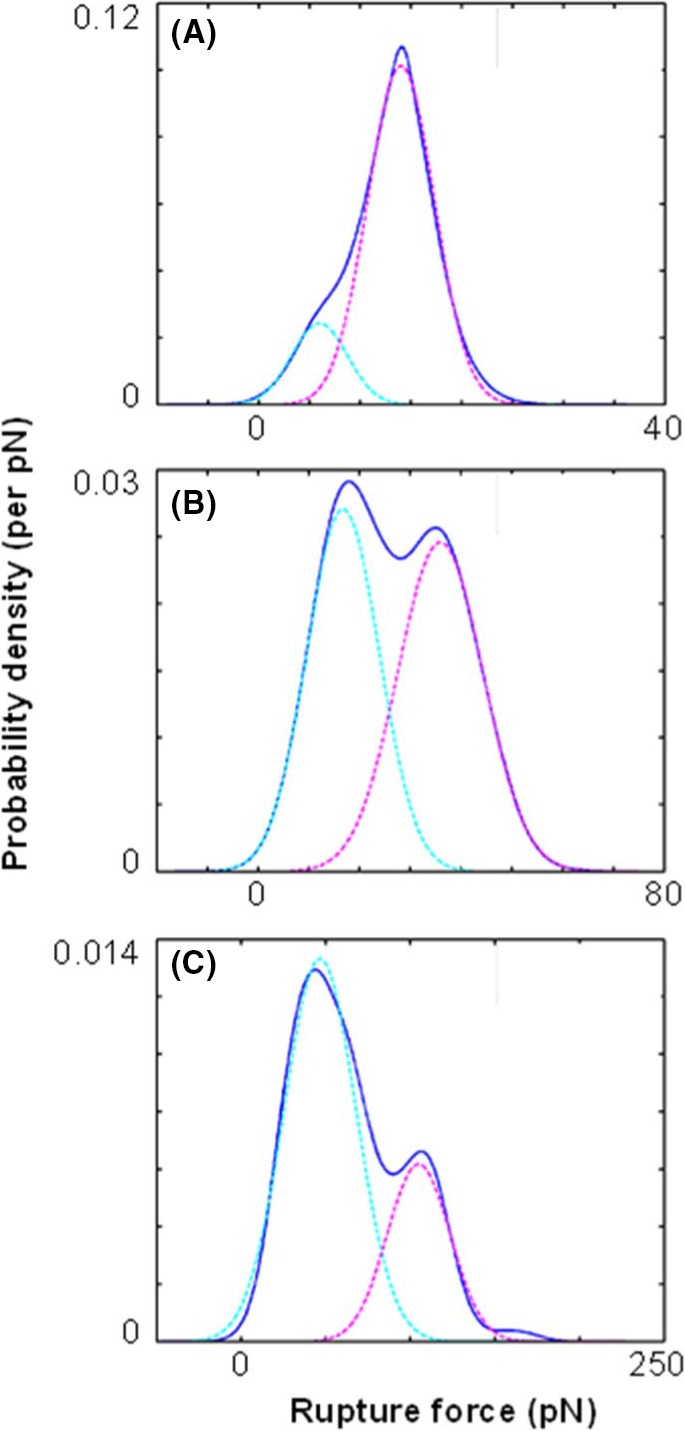
Figure 4.

Distribution of rupture forces between a cantilever tip functionalized with monoclonal anti‐heparan sulfate antibody and a stripped abdominal skin sample at different loading rates. The experimentally acquired probability density function (pdf) curves (solid lines) at loading rates of (A) 14, (B) 200, and (C) 16000 pN/s are shown. The measured distributions were fitted with a sum of 2 Gaussians. These Gaussians (dashed lines) are interpreted as single antibody arm unbinding (cyan) and double antibody arm rupture (magenta). The shift of the most probable rupture force for both unbinding modes with increasing loading rates can be seen [Colour figure can be viewed at wileyonlinelibrary.com]
