
. 2018 Mar 1;46(4):343–351. doi: 10.1111/cdoe.12372
© 2018 The Authors. Community Dentistry and Oral Epidemiology Published by John Wiley & Sons Ltd
This is an open access article under the terms of the http://creativecommons.org/licenses/by/4.0/ License, which permits use, distribution and reproduction in any medium, provided the original work is properly cited.
Figure 1.
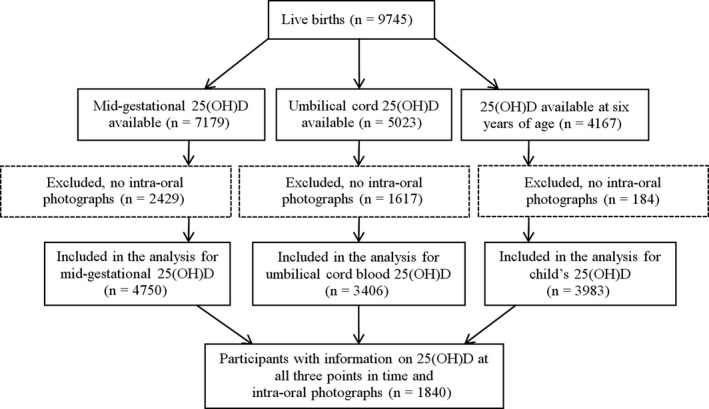
Flow chart of participants