
Figure 1.
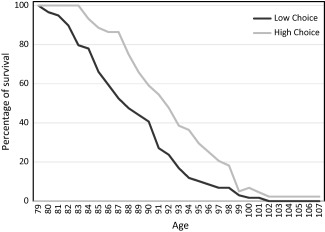
Percentage of survival to age (defined in x‐axis) as a function of high (+1SD) and low (−1SD) choice as coded in essays
Official websites use .gov
A
.gov website belongs to an official
government organization in the United States.
Secure .gov websites use HTTPS
A lock (
) or https:// means you've safely
connected to the .gov website. Share sensitive
information only on official, secure websites.
Percentage of survival to age (defined in x‐axis) as a function of high (+1SD) and low (−1SD) choice as coded in essays