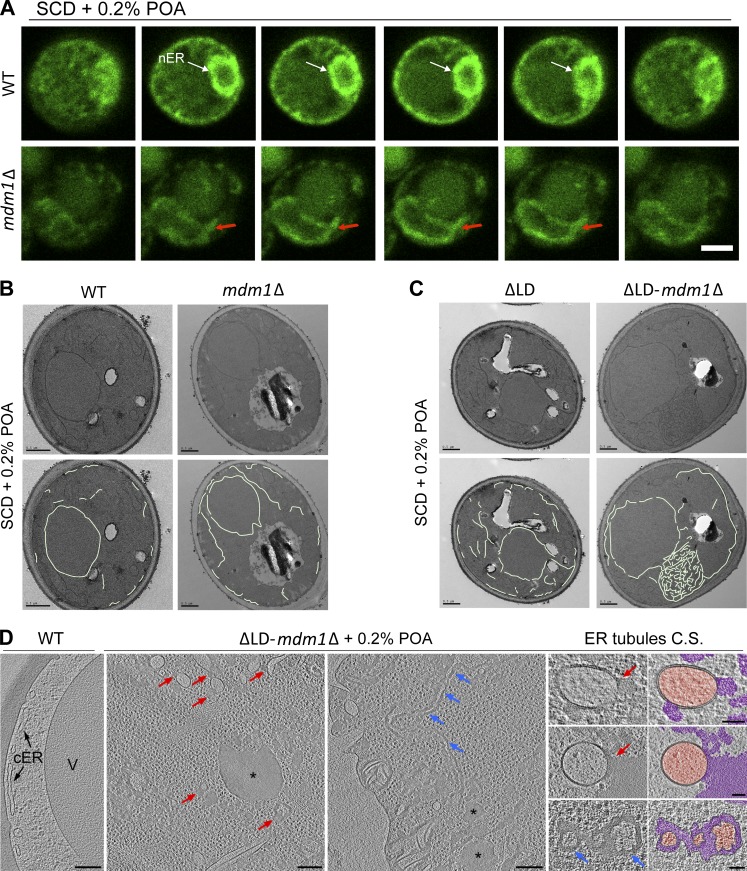
Figure 5.
Loss of MDM1 perturbs ER morphology and sensitizes yeast to lipotoxicty. (A) Slices from confocal microscopy of WT (top) and mdm1Δ (bottom) yeast fed 0.2% POA. ER (green) is marked by endogenous GFP-HDEL tagging. Arrows indicate deformed nuclear ER (nER) morphology in mdm1Δ yeast compared with WT. Scale bar, 2 µm. (B) Top: Thin-sectioning TEM of WT and mdm1Δ yeast fed 0.2% POA. Bottom: Manual tracing of the ER membrane. Scale bar 0.5 µm. (C) Top: Thin-sectioning TEM of LD-null (ΔLD) and ΔLD-mdm1Δ yeast fed 0.2% POA. Bottom: Manual tracing of the ER membrane. Scale bar, 0.5 µm. (D) Slices from cryotomographic reconstructions of WT and ΔLD-mdm1Δ yeast cryo-FIB sections (cultured in 0.2% POA for 6 h). Red arrows point at local bulges of FA deposits (asterisks) and blue arrows at large-range FA deposits between the membrane bilayer. Cross sections (C.S.) of ER tubules found in ΔLD-mdm1Δ yeast are shown both as raw tomographic slices and pseudocolored (orange, ER lumen; magenta, abnormal FA deposits). Scale bars, 200 nm (overviews) and 50 nm (C.S. zoom-ins in the right column).

