Figure 6.
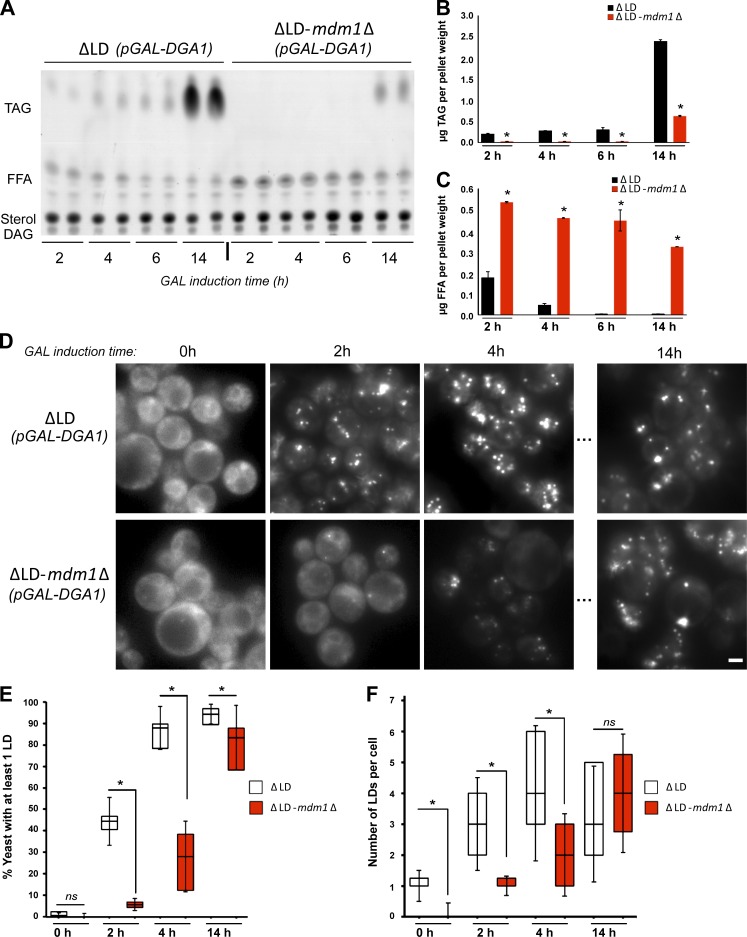
Loss of MDM1 perturbs LD biogenesis. (A) TLC of neutral lipids extracted at different time points after galactose (GAL) induction of Dga1 expression from ΔLD and ΔLD-mdm1Δ yeast. (B) Quantification of TAG levels from TLC in A (in micrograms). Data represent mean ± SD normalized to cell pellet weight; n = 2. *, P < 0.01; **, P < 0.005; two-way ANOVA. (C) Quantification of FFA levels from TLC in A (in micrograms). Data represent mean ± SD normalized to cell pellet weight; n = 2. *, P < 0.01; **, P < 0.005; two-way ANOVA. (D) Light microscopy ΔLD and ΔLD-mdm1Δ yeast at different time points after GAL induction of Dga1 expression. LDs (gray) visualized by MDH staining. Scale bar, 2 µm. (E) Quantification of the percentage of yeast cells with LDs at different time points after GAL induction of Dga1 expression. Data represent the number of cells over the total; mean ± SD; n > 50 cells; *, P < 0.01; Student’s t test. (F) Quantification of the number of LDs in ΔLD and ΔLD-mdm1Δ yeast at different time points after GAL induction of Dga1 expression. Data represent the number of LDs per cell over the total number of cells; mean ± SD; n > 50 cells; *, P < 0.01; Student’s t test.

