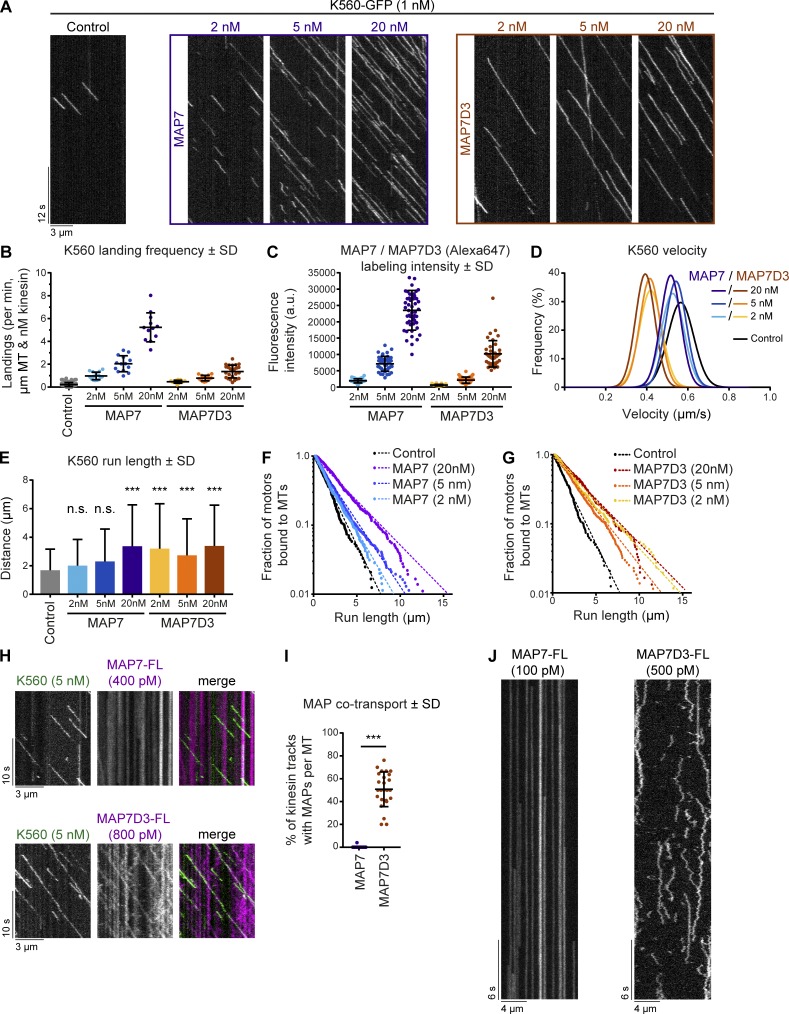
Figure 6.
Density and mobility of MAP7 determine kinesin-1 landing and processivity. (A) Kymographs of K560-GFP on dynamic MTs in control conditions or in the presence of increasing concentrations of MAP7 or MAP7D3. (B) Quantification of kinesin landing frequencies per MT and corrected for MT length, time of acquisition, and kinesin concentration. n = 167, 15, 14, 12, 13, 15, and 25 MTs from two independent experiments. (C) Quantification of SNAP(Alexa Fluor 647)–tagged MAP7 and MAP7D3 intensities on dynamic MTs using images acquired under identical conditions on a TIRF microscope. n = 39 to 49 MTs from two independent experiments. Representative images are shown in Fig. S4 A. (D) Gaussian fits of kinesin velocities. Histograms are shown in Fig. S4 B. (E) Quantification of K560-GFP run length. n = 241, 351, 614, 361, 257, 436, and 303 kinesin runs from two independent experiments. ***, P < 0.001, Mann–Whitney U test. (F and G) Cumulative distributions of K560-GFP run lengths measured in the presence of increasing concentrations of MAP7 (F) or MAP7D3 (G). Straight dashed lines correspond to single exponential fits, n numbers correspond to E. (H) Kymographs of dual-color in vitro reconstitution experiments with K560-GFP and SNAP(Alexa Fluor 647)–tagged MAP7 or MAP7D3. (I) Quantification of kinesin tracks positive for MAP7 or MAP7D3 cotransport; n = 417 from 19 MTs (MAP7) and n = 344 from 25 MTs (MAP7D3) from two independent experiments. ***, P < 0.001, Mann–Whitney U test. (J) Kymograph of a single SNAP(Alexa Fluor 647)–tagged MAP7 or -MAP7D3 molecule on dynamic MTs in vitro. Videos were acquired at 25 frames/s on a TIRF microscope.

