Figure 1.
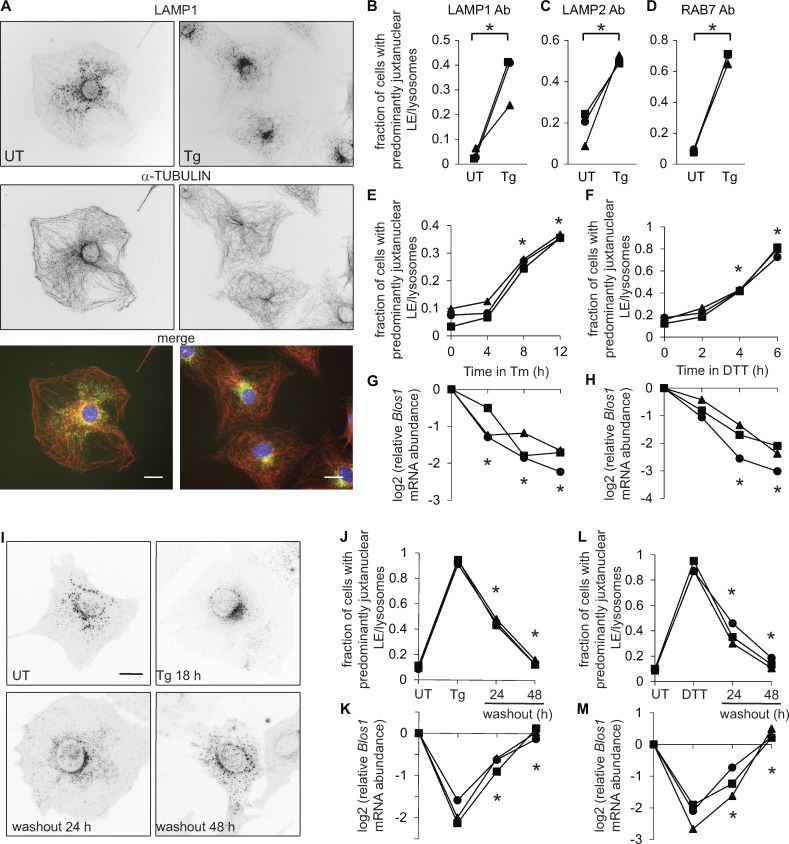
LEs/lysosomes cluster near the MTOC during ER stress. For all graphs throughout the figures: symbols represent independent experiments and are maintained among related panels; lines connect data from the same replicate experiment. (A) We treated MC3T3-E1 cells with Tg (2 µM, 18 h), fixed and stained with DAPI (blue) and antibodies for LAMP1 (green) and α-tubulin (red), and imaged on a wide-field fluorescence microscope. Nonmerged images are inverted for visualization. (B–D) We treated cells as in A; stained with antibodies for LAMP1, LAMP2, or RAB7; and scored cells for juxtanuclear LE/lysosome clustering. (E–H) We treated MC3T3-E1 cells stably expressing LAMP1-GFP with Tm (4 µg/ml) or DTT (2 mM), and then imaged live cells and collected RNA in parallel. We measured relative Blos1 mRNA levels by quantitative real-time RT-PCR. (I–M) We treated LAMP1-GFP cells with Tg (2 µM, 18 h) or DTT (2 mM, 4 h), then washed out the stressor to follow recovery. *P < 0.05, paired t test (B–D) or ANOVA followed by Tukey’s honestly significant difference test (E–H and J–M); n = 3. Only comparisons between stressed versus UT cells (E–H) or before versus after washout (J–M) are shown. Scale bars, 10 µm. Ab, antibody; UT, untreated.

