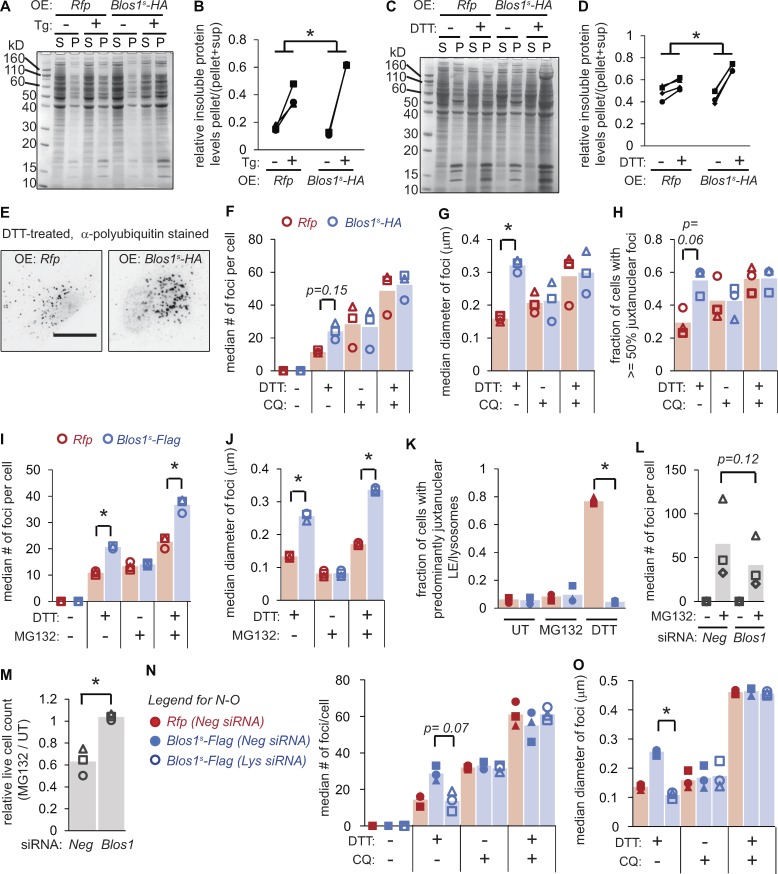
Figure 4.
Overriding RIDD of Blos1 results in accumulation of protein aggregates. (A–D) We treated MC3T3-E1 cells stably expressing the indicated mRNAs with either Tg (2 µM, 18 h) or DTT (2 mM, 4 h), lysed in RIPA buffer, separated soluble (S) and insoluble (P) material by centrifugation, and analyzed by SDS-PAGE and Coomassie blue staining. A and C are representative gel images, and B and D show quantification of three experiments. *P < 0.05, paired t tests for Rfp compared with Blos1s cells (stressed/UT). (E–H) We treated cells as in C and D, except that we added CQ (120 µM) for the final 2 h of treatment, where indicated. We then fixed and stained cells with an antibody for polyubiquitin and analyzed foci as described in Materials and methods. E shows representative images (inverted, scale bar = 10 µm). (I–K) We treated cells with DTT (2 mM) and/or MG132 (10 µM) for 4 h, and then analyzed polyubiquitin foci as in F and G or LE/lysosome clustering by LAMP immunostaining. (L and M) We depleted MC3T3-E1 cells of Blos1 using siRNAs, then treated with MG132 (10 µM) and analyzed polyubiquitin foci (after 4 h) or counted live cells (after 18 h). (N and O) We depleted cells of the BORC component lyspersin (Lys) using siRNAs, then analyzed polyubiquitin foci as in F and G. Lys mRNA levels in depleted cells were 0.21 ± 0.09, relative to Neg controls, as measured by qPCR. *P < 0.05, Rfp versus Blos1s (F–K) or Neg versus Blos1 or Lys RNAi (L–O), from paired t tests with corrections for multiple comparisons; n = 3. All P values between 0.05 and 0.15 are shown. UT, untreated; OE, overexpressed.

