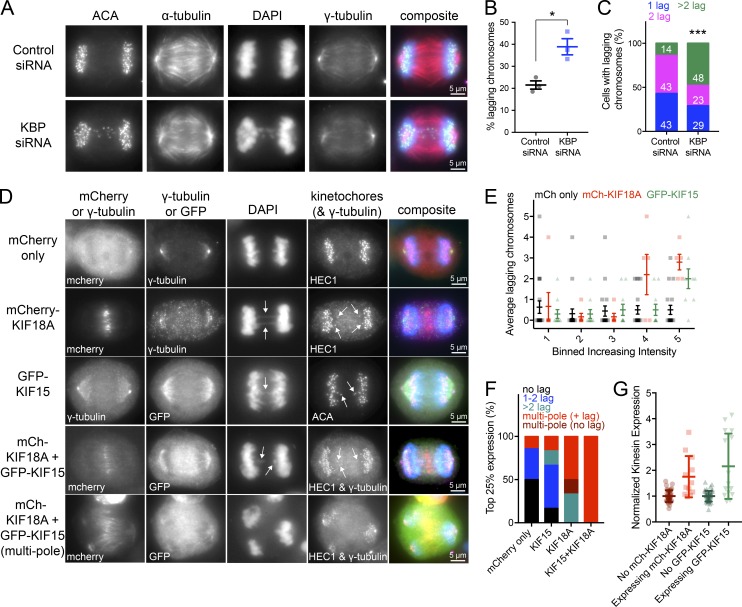
Figure 9.
Cells deficient in KBP or overexpressing KIF18A and/or KIF15 display multiple lagging chromosomes in anaphase. (A) Anaphase cells treated with control or KBP siRNAs. (B) Quantification of the percentage of lagging chromosomes under the two knockdown conditions. *, P = 0.0136 by unpaired, two-tailed t test. Data were obtained from three independent experiments with the following cell numbers: control siRNA (66) and KBP siRNA (82). (C) Among the cells with lagging chromosomes, quantification of the number of lagging chromosomes per cell: one lagging chromosome, blue; two lagging chromosomes, pink; and more than two lagging chromosomes, green. White numbers indicate percentage for each group. The number of cells with lagging chromosomes analyzed are as follows: control siRNA (13) and KBP siRNA (31). ***, P < 0.001 by χ2 analysis. (D) Anaphase cells overexpressing either mCherry only, mCherry-KIF18A, GFP-KIF15, or both mCherry-KIF18A and GFP-KIF15. Arrows point to lagging chromosomes. (E) Quantification of the average lagging chromosomes in cells as a function of mCherry (mCh) only, mCh-KIF18A, or GFP-KIF15 overexpression level. Background-subtracted fluorescence intensity values were equally divided into bins. Individual data points are shown in the background; foreground shows the average number of lagging chromosomes with SDs. Data were obtained from seven independent experiments with the following cell numbers: mCh only (92), mCh-KIF18A (28), and GFP-KIF15 (49). Bin 4 mCh only versus mCh-KIF18A adjusted P = 0.0044; bin 5 mCh only versus mCh-KIF18A adjusted P < 0.0001; bin 5 mCh only versus GFP-KIF15 adjusted P = 0.0016 with 95% confidence interval by two-way ANOVA with Tukey’s multiple comparisons test. (F) Breakdown of the number of lagging chromosomes or multipolar spindle phenotypes observed in the 25% highest expressing cells for each condition. No lagging chromosomes, black; one or two lagging chromosomes, blue; more than two lagging chromosomes, green; multipolar spindles with lagging chromosomes, red without lagging chromosomes, dark red. Data were obtained from four independent experiments with the following total cell numbers: mCh only (55), mCh-KIF18A (19), GFP-KIF15 (23), and mCh-KIF18A and GFP-KIF15 (18). P < 0.0001 by χ2 analysis. (G) Normalized kinesin expression levels in anaphase cells. Anaphase cells were imaged and partitioned into either expressing or not expressing mCh/GFP tagged kinesins. Plot displays background-subtracted immunofluorescence levels from KIF18A- or KIF15-specific antibodies normalized to the average from untransfected cells. Average fold increase in kinesin expression above endogenous for each kinesin: mCh-KIF18A (1.75) and GFP-KIF15 (2.16). All error bars represent SD. Data were obtained from two independent datasets with the following cell numbers: KIF18A not expressing mCh-KIF18A (39), KIF18A expressing mCh-KIF18A (12), KIF15 not expressing GFP-KIF15 (46), and KIF15expressing GFP-KIF15 (15).

