Figure 3.
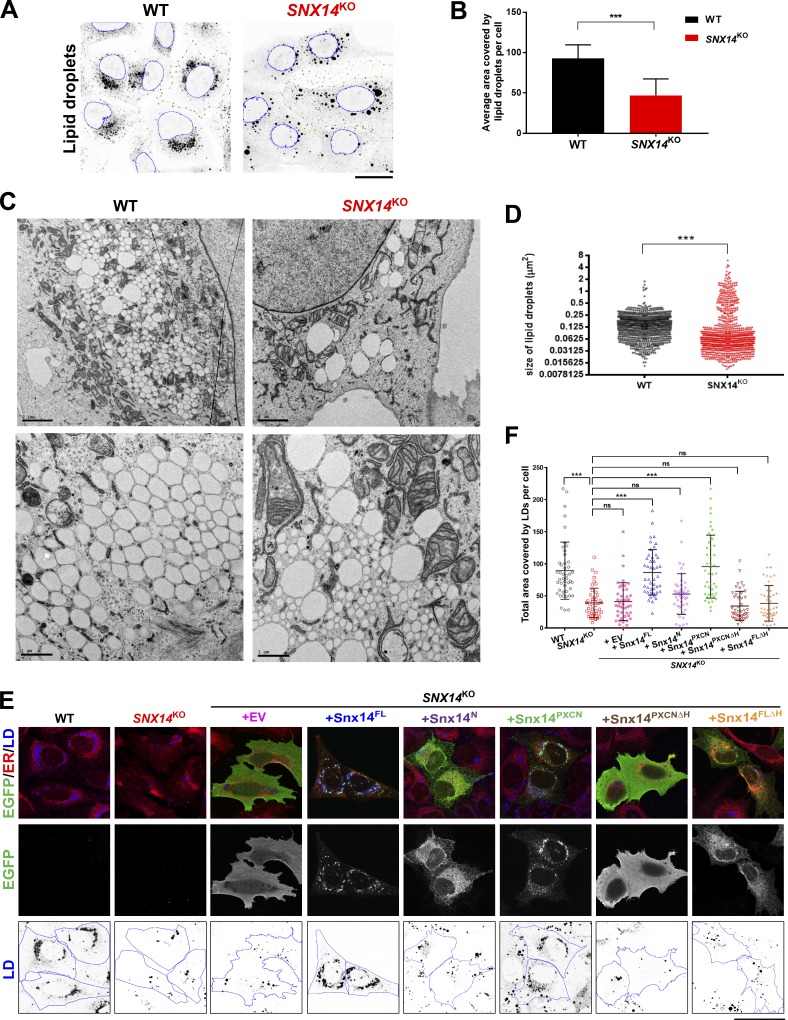
Loss of Snx14 perturbs LD size and morphology but does not change neutral lipid levels. (A) Confocal micrographs of WT and SNX14KO cells treated with OA overnight. LDs visualized by MDH (black) and nucleus stained with Syto 85 orange fluorescent stain (blue outline). Images were processed so that LDs were converted to grayscale and inverted. Scale bar = 25 µm. (B) Quantification of average area covered by LDs per cell of representative images from A. Total LD area was derived from more than five fields of view, each consisting of approximately five cells or more of two different sets of experiments (total no. of cells >75; ***, P < 0.0001 unpaired t test with α = 0.05). (C) TEM micrographs of WT and SNX14KO cells treated with OA overnight to visualize LD distribution and morphology. The top panels are lower magnification (scale bar = 2 µm). The bottom panels are higher magnification (scale bar = 1 µm). (D) Scatter dot plot of cross-sectional areas of LDs in WT and SNX14KO cells as in C. Total LDs = 896; ***, P < 0.0001, Kolmogorov–Smirnov D test with α = 0.05. (E) Rescue of LD morphology in SNX14KO cells by readdition of empty vector (EV), Snx14FL, Snx14N, Snx14PXCN, Snx14PXCNΔH, and Snx14FLΔH, respectively, all tagged with EGFP. Cells were coIF stained with α-EGFP (green), α-HSP90B1 (ER, red), and LDs stained with MDH (blue) and imaged with confocal microscope. Scale bar = 50 µm. (F) Area covered by LDs in each cell from E analyzed and plotted. Total no. of cells quantified are 45 from two different sets of experiments (***, P < 0.0001, one-way ANOVA with α = 0.05). Line bars indicate mean ± SD.

