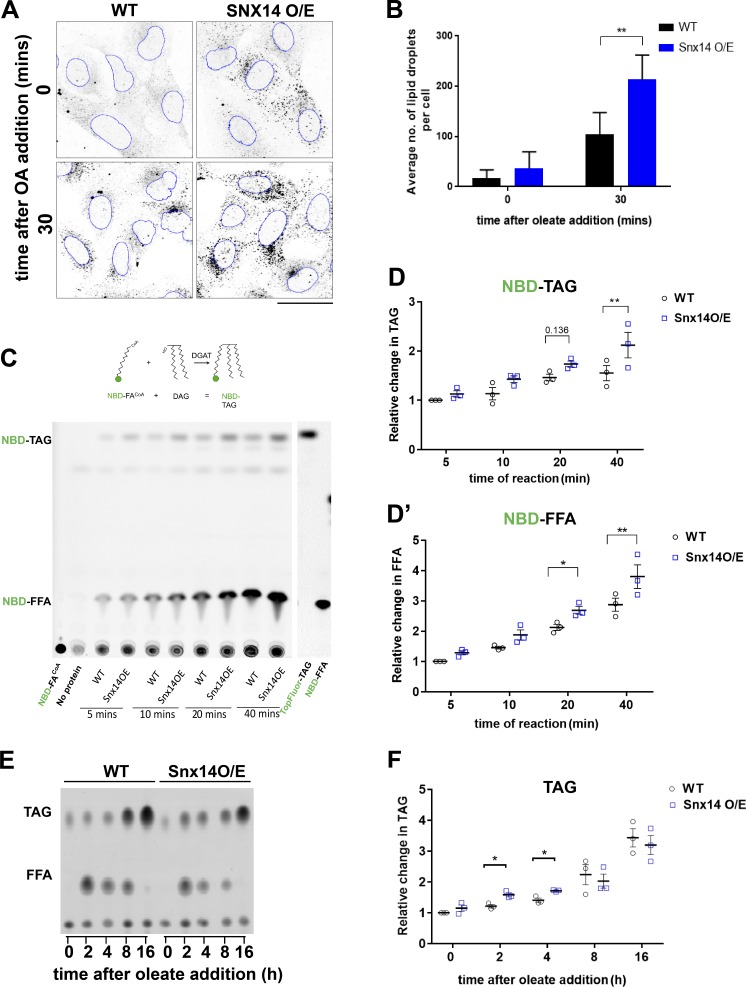
Figure 7.
Snx14 promotes LD biogenesis and enhances TAG synthesis. (A) Confocal micrographs of WT and Snx14Flag O/E U2OS cells either without OA or following 30 min OA treatment. LDs were labeled with Nile Red and converted to grayscale. ImageJ was used to mark the border of nuclei in blue. Scale bar = 50 µm. (B) Quantification of average number of LDs per cell of representative image from A. Each set of values was analyzed from five fields of view, each consisting of >10 cells of two different sets of experiments (total no. of cells >100; **, P < 0.001, multiple t test by Holm–Sidak method with α = 0.05). (C) Schematic diagram depicting fluorescent in vitro assay to measure NBD-FACoA incorporation into NBD-TAG. TLC of fluorescent NBD-FA-CoA incorporated into neutral lipids over time. WT and Snx14Flag O/E cells were pulsed with NBD-FA-CoA and collected at 5-, 10-, 20-, and 40-min time points. (D) Quantification of relative fold change in NBD-TAG (D) and NBD-FFA (D′) of TLC from C. Values are normalized to protein concentration and represent mean ± SEM (n = 3; *, P < 0.01; **, P < 0.001, multiple t test by Holm–Sidak method with α = 0.05). (E) TLC of neutral lipids in WT cells and cells overexpressing Snx14EGFP treated with OA for 0, 2, 4, 8, and 16 h. (F) Quantification of relative fold change in TAG (normalized to cell pellet weight) of TLC from E. Values represent mean ± SEM (n = 3; *, P < 0.01, multiple t test by Holm–Sidak method with α = 0.05).

