Figure 5.
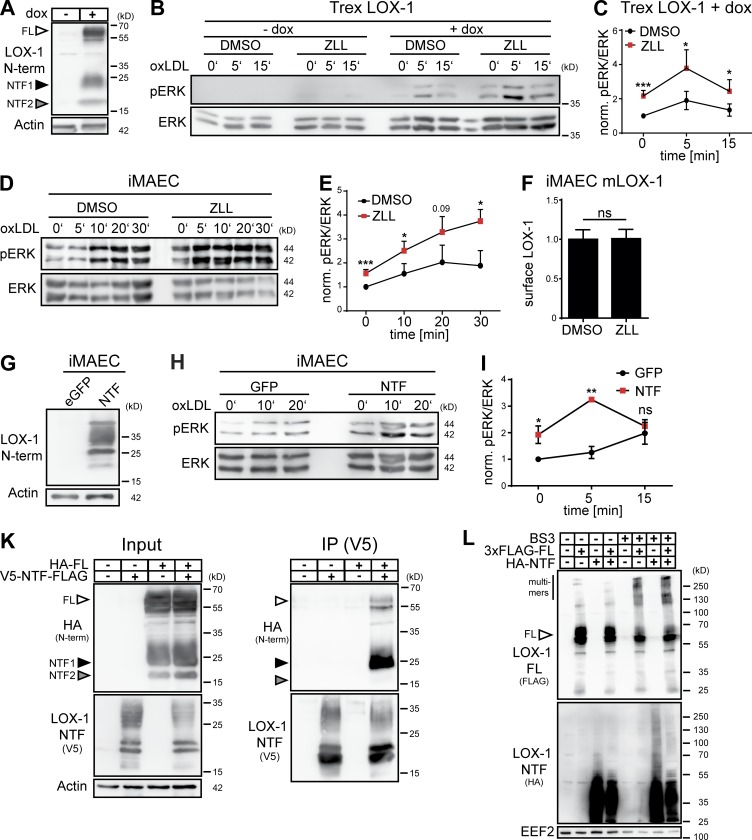
The LOX-1 NTF regulates MAP kinase activity. (A) T-REx FlipIn cells inducibly overexpressing LOX-1 were generated. LOX-1 expression after induction with 10 µg/ml doxycycline (dox) for 24 h was confirmed by Western blotting. (B) LOX-1 expression was induced in T-REx FlipIn cells (+dox) or cells were left uninduced (–dox). Prior to stimulation with 40 µg/ml oxLDL, cells were cultured in serum-free DMEM for 4 h in the presence of 40 µM ZLL or DMSO. pERK and total ERK1/2 (ERK) levels were determined. (C) Quantification of B. N = 4, n = 4. Student’s t test. (D) iMAECs were incubated with 40 µM ZLL or DMSO for 24 h. For the last 4 h, cells were transferred to serum-free DMEM before treatment with 40 µg/ml oxLDL and analysis of ERK1/2 activation. (E) Quantification of D. N = 4, n = 4. Student’s t test. (F) LOX-1 surface levels were analyzed by flow cytometry in iMAECs stably overexpressing LOX-1 after 24 h treatment with 40 µM ZLL. N = 2, n = 6. Student’s t test. (G) Stable expression of the LOX-1 NTF in transduced iMAECs was validated. (H) Transduced iMAECs were cultivated for 4 h under serum-free conditions before stimulation with 40 µg/ml oxLDL and assessment of MAP kinase activation. (I) Quantification of H. N = 3, n = 3. Student’s t test. (K) HeLa cells were transfected as indicated with differentially tagged full-length LOX-1 and NTF. Interaction of both proteins was analyzed by coimmunoprecipitation using anti-V5. (L) HeLa cells transfected with 3xFLAG-LOX-1 (3xFLAG-FL) and/or HA-LOX-11-88 (HA-NTF) were treated for 30 min with BS3 and subsequently analyzed by Western blotting. As described in Materials and methods, phosphorylated and total forms of ERK were detected from the same membranes. After detection of pERK, the respective membranes were stripped and reprobed to detect total ERK. ***, P ≤ 0.001; **, P ≤ 0.01; *, P ≤ 0.05; ns, not significant. N, the number of independent experiments; n, the number of individual samples for quantification. All data are shown as mean ± SD.

