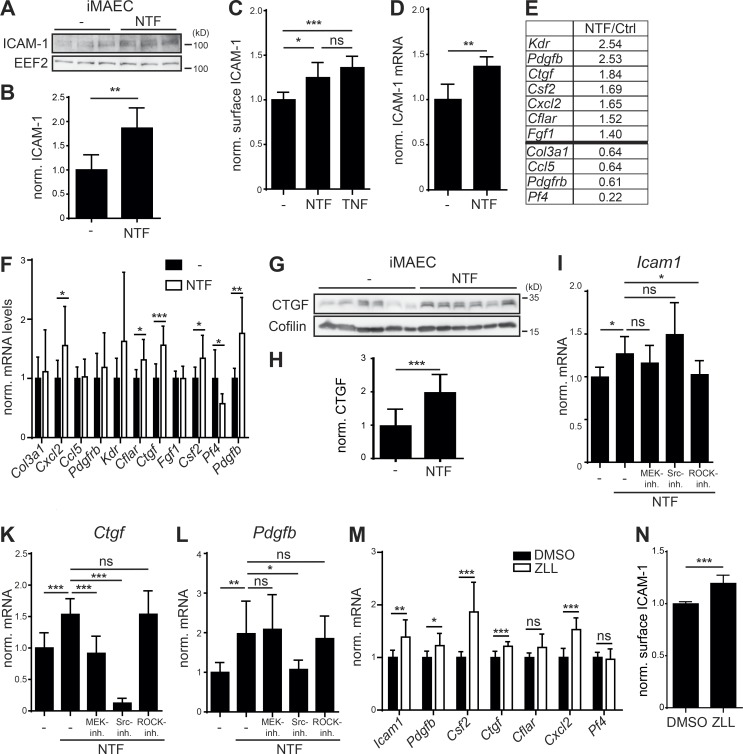
Figure 7.
Accumulation of the LOX-1 NTF induces a pro-atherogenic state in endothelial cells. (A) Expression of ICAM-1 was analyzed in control (–) or LOX-1 NTF transduced iMAECs by Western blotting. (B) Quantification of A. N = 2, n = 6. Student’s t test. (C) Up-regulation of surface ICAM-1 in LOX-1 NTF transduced iMAECs was validated by flow cytometry. As a control, cells were treated with 5 ng/ml TNF. N = 2, n = 6. One-way ANOVA with Tukey’s post hoc test. (D) Up-regulation of Icam-1 was validated by qPCR. N = 2, n = 6. Student’s t test. (E) Candidate genes from endothelial cell biology and atherosclerosis RT2 Profiler arrays with differential regulation between control and iMAEC NTF cells. (F) Differences in mRNA levels of the selected genes were validated by qPCR. N = 2–3, n = 6–9. Student’s t test. (G) Secretion of CTGF was blocked in iMAEC control (−) or NTF cells by incubation with Brefeldin A (1 µg/ml) for 6 h. Intracellular CTGF levels were analyzed by Western blotting. (H) Quantification of G. N = 2, n = 12. Student’s t test. (I–L) iMAEC control or NTF cells were treated for 3 h with 25 µM U0126 (MEK-Inh.), 1 µM Saracatinib (Src-Inh.), or 10 µM Y-27632 (ROCK-Inh.) or left untreated as indicated. Icam-1 (I, N = 3–4, n = 9–12), Ctgf (K, N = 3, n = 8–9), and Pdgfb (L, N = 3, n = 8–9) mRNA levels were quantified by qPCR. One-way ANOVA with Dunnett’s post hoc test. (M) Up-regulation of validated candidate genes was monitored in iMAECs treated for 16 h with either DMSO or 40 µM ZLL. N = 2–3, n = 6–9. Student’s t test. (N) Up-regulation of ICAM-1 upon ZLL administration was validated by flow cytometry. N = 3, n = 11. Student’s t test. ***, P ≤ 0.001; **, P ≤ 0.01; *, P ≤ 0.05; ns, not significant. N, the number of independent experiments; n, the number of individual samples for quantification. All data are shown as mean ± SD.

